Download
1 / 10
100 likes | 229 Views
BnSTM BrSTM BoSTM. WT L2 L3 L4 L5 L6 L15 L21 L23 L2 L5 L7 L8. AtUBQ10. AtSTM. AtSTM. AtSTM. AtCLV1. At/BnCLV1. At/BoSTM. At/BrSTM. At/BnSTM. BnCLV1. WT.

E N D
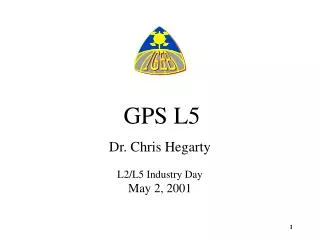
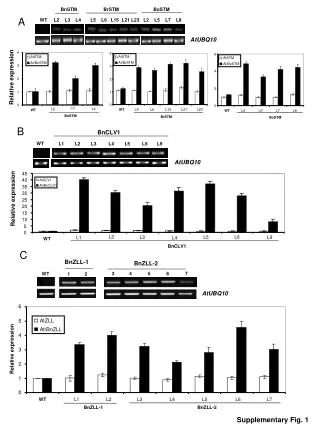
BnSTM BrSTM BoSTM WT L2 L3 L4 L5 L6 L15 L21 L23 L2 L5 L7 L8 AtUBQ10 AtSTM AtSTM AtSTM AtCLV1 At/BnCLV1 At/BoSTM At/BrSTM At/BnSTM BnCLV1 WT L1 L2 L3 L4 L5 L6 L9 AtUBQ10 4 3 2 WT 3 4 5 6 7 1 2 1 0 A 4 6 3 4 Relative expression 2 2 1 0 0 L3 L4 L2 L23 WT L5 L6 L15 L21 WT WT L2 L5 L7 L8 BnSTM BrSTM BoSTM B 45 40 35 30 Relative expression 25 20 15 10 5 0 L2 L6 L3 L5 L9 L1 L4 WT BnCLV1 C BnZLL-1 BnZLL-2 AtUBQ10 6 AtZLL 5 At/BnZLL 4 Relative expression 3 2 1 0 WT L1 L2 L3 L4 L5 L6 L7 BnZLL-1 BnZLL-2 Supplementary Fig. 1
Supplementary Fig. 1. Identification of Arabidopsis lines ectopically expressing the Brassica genes. Expression studies by quantitative RT-PCR were conducted using 10 day old seedlings. (A) Identification of lines expressing Brassica napusBnSTM (line 2, 3, and 4), B. rapa BrSTM (line 5, 6, 15, 21, and 23) and B. oleraceaBoSTM (line 2, 5, 7, and 8). Top panel: Insertion of the transgene in the genomic DNA was verified by PCR using a forward 35S promoter primer (5’-TGGACCCCCACCCACGAG-3’) and a reverse gene specific primer common for the three genes (5’-GCACCAGAGGAAGGAGAACA-3’). Ubiquitin (AtUB10) primers (5’-GATCTTTGCCGGAAAACAATTGGAGGATGGT-3’ and 5’-CGACTTGTCATTAGAAAGAAAGAGATAACAGG-3’) were used to assess the quality of the DNA for PCR. Bottom panels: the level of endogenous AtSTM (5’-TAGATCAAAAAAGCTTTA-3’ and 5’-CATTACTTCATGGATAATGTCTTGGG-3’) and endogenous + exogenous, i.e. AtSMT + the relative Brassica STM (5’-TGATGGTCCGATGTGTCCTA-3’ and 5’-GCACCAGAGGAAGGAGAACA-3’) measured by quantitative qRT-PCR. (B) Identification of 7 lines ectopically expressing BnCLV1 (line 1, 2, 3, 4, 5, 6, and 9)using the same approach as in (A). BnCLV1 specific primers used for the amplification of DNA: (5’-TCTCCTTCAACGACCTCTCG-3’ and 5’-CTGGTGAAGATAACACAGTCCTTTCG-3’), and for the qRT-PCR analysis: AtCLV1 (5’-GTAAAATTTCTCTATTCACAAATGATAA-3’ and 5’-AAGATGAGTCTTCAAAAGTCTCATCGC-3’) and endogenous + exogenous, i.e. AtCLV1 + Brassica CLV1 (5’-TCTCCTTCAACGACCTCTCG-3’ and 5’-AGACGATCCCCGCTCCGCCTTTG-3’). (C) Identification of lines over-expressing BnZLL-1 (line 1 and 2)or BnZLL-2 (line 3, 4, 5, 6, and 7) using the same approach as in (A). Specific BnZLL primers used for the amplification of DNA (5’-AACTCCAACTTTGCGCCGAGA-3’ and 5’-TTTTCTTTCCCATTCTCATGATAC-3’), and for the qRT-PCR analysis: AtZLL (5’-CTTCTCTAGCGTCACTCTTCTTCTT-3’ and 5’-TCACCGGAGAAGGAGAAGGAGGA-3’), and endogenous + exogenous AtZLL + BnZLL-1 or -2 (BnZLL-1, 5’-GACGACGACGGCGGCAGCTCAGAGCC-3’ and 5’-CAGACTCTTTGTATAGTCTCACTA-3’; BnZLL-2, 5’-ACTCCGAGCCAAGCTTCTTCAC-3’ and 5’- CAGACTCTTTGTATAGTCTCACTA-3’). Values + SE (n=3) were compared to the expression level of endogenous At genein WT plants set at 1. The relative level of gene expression was analyzed with the 2 -∆∆CT method described by Livak and Schmittgen (2001)
Flowers (mature plant) Shoot tips (mature plant) Shoot tips (seedling) 12 10 8 Relative expression 6 4 2 0 WT S101 S15 S23 S27 1.2 0.8 Relative expression 0.4 0 WT A5 A6 Supplementary Fig. 2. Identification of Brassica napus lines transformed with BnSTM in sense (S, line 101, 15, 23, and 27) or antisense (A, line 5 and 6) orientation. The expression level was measured in different organs of seedlings (15 day old) or mature (40 day old) plants. For mature plants fully open flowers and 3 cm long siliques were used. Expression studies were conducted by quantitative RT-PCR using the following primers (5’-TGATGGTCCGATGTGTCCTA-3’ and 5’-GCACCAGAGGAAGGAGAACA-3’). Actin (5’- TAAAGTATCCGATTGAGCATGGTAT -3’ and 5’-GACATTAAAGAGAAGCTTGCTTACG -3’) was used as the internal control. Values + SE, which are means of three independent experiments, were compared to the expression of the endogenous BnSTM in the respective WT organ. The relative level of gene expression was analyzed with the 2 -∆∆CT method described by Livak and Schmittgen (2001) Supplementary Fig. 2
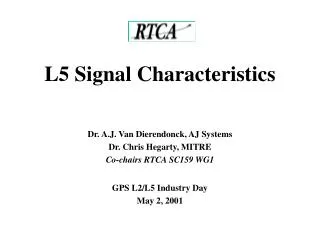
A 1 382 BnSTM KNOX 1 KNOX 2 ELK HOMEODOMAIN ELK Homeodomain AtSTM BnSTM BOSTM-1 ChSTM PsHOP1 SdSTM SrSTM GmSBH1 B Ser/Tr KINASE AtCLV1 AtCLV1 AtCLV1 BnCLV1 BnCLV1 BnCLV1 AtBAM2 AtBAM2 AtBAM2 AtBAM1 AtBAM1 AtBAM1 1 987 AtBAM3 AtBAM3 AtBAM3 BnCLV1 CtCLV1 CtCLV1 CtCLV1 Ser/Tr KINASE PpCLV1 PpCLV1 PpCLV1 OsCLV1 OsCLV1 OsCLV1 C PAZ PIWI 1 982 BnZLL-1 PIWI AtAGO1 AtAGO2 AtZLL AtZP1 BnZLL-1 BnZLL-2 Supplementary. Fig. 3
Supplementary Fig. 3. Schematic representation of protein structure and amino acid sequence alignments of conserved domains of BnSTM, BnCLV1, and BnZLL-1. High levels of identity with domains of related proteins of other species are shown for the ELK and homeodomain regions of BnSTM (A), for the serine/threonine kinase domain of BnCLV1 (B), and for the PIWI domain of BnZLL-1 (C). The structure and the PIWI domain of BnZLL-2 is identical to those shown for BnZLL-1. Arabidopsis thaliana AtSTM (NP_176426 ); Brassica napus BnSTM(GU480585); Brassica oleracea BoSTM (AAM89270 ); Cardamine hirsute ChSTM (ABF59514 ); Pisum sativum PsHOP1 (AAC33008); Streptocarpus dunnii SdSTM (AAW33773); Streptocarpus rexii SrSTM (AAW33774); Glycine maxGmSBH1 (L13663.1); Arabidopsis thalianaAtCLV1(NP_177710); Arabidopsis thalianaAtBAM2 (NP_190536); Arabidopsis thalianaAtBAM1(NP_201371 ); Arabidopsis thalianaAtBAM3 (NP_193760 ); Clostridium tetani CtCLV1 (NP_782560); Physcomitrella patentsPpCLV1 (XP001763746); Oryza sativa OsCLV1(NP_001062883); AtAGO1 (NP_175274); AtAGO2 (NP_174413); AtZLL (NP_199194 ); AtZP1(NP_199194 ). Multiple alignment analyses were conducted using T-Coffee/ClustaIW2 (http://www.ebi.ac.uk/Tools/t-coffee/)
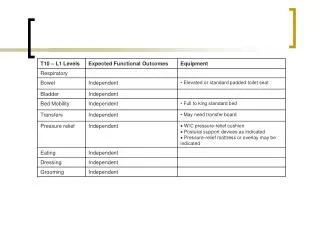
A B C Supplementary Fig. 4
Supplementary Fig. 4. Phylogenetic trees of several class-1 KNOX proteins (A), CLAVATA 1-related proteins (B), and ZLL-like proteins (C). Phylogenetic relationship was based on the analyses of amino acid sequences of full length proteins. Brassica oleracea BoSTM-1 (AAM89270 ); Arabidopsis thaliana AtSTM (NP_176426 ); Cardamine hirsute ChSTM (ABF59514 ); Arabidopsis thalianaHomeobox1 AtH1 (NP_195024); Arabidopsis thalianaBEL1-like homeodomain 1 AtBELL1 (AAK43836); Arabidopsis thalianaHomeobox protein KONTTED-1 Like 4 (KNAT4) (CAC03454); Arabidopsis thalianaHomeobox protein knotted-1-like5 AtKNAT5 (NP_194932); Arabidopsis thalianaHomeobox protein knotted-1-like3 AtKNAT3 (NP_001031938); Streptocarpus dunnii SdSTM (AAW33773); Streptocarpus rexii SrSTM (AAW33774); Arabidopsis thalianaHomeobox protein knotted-1-like1 AtKNAT1 (NP_192555); Arabidopsis thalianaHomeobox protein knotted-1-like2 AtKNAT2 (NP_177208); Arabidopsis thalianaHomeobox protein knotted-1-like 6AtKNAT6 (NP_173752); Arabidopsis thalianaAtBAM1 (NP_201371); Physcomitrella patentsPpCLV1 (XP001763746); Oryza sativa OsCLV1(NP_001062883); Arabidopsis thalianaAtZLL (CAA11429); Picea glaucaPgZLL (AAY67884); Ricinus communis RcDC1 (XP_002515097); Brassica rapa BrDICER-like protein (ACE60552); Oryza sativa OsDCL (ABB20894); Populus trichocarpa PtDCL (XP_002308384); AtAGO1 (ACB30738); AtAGO2 (ACB30762). The phylogenetic trees were constructed with the UPGEMA method using MEGA 4.0.2 software (Tamura et al., 2007).
1 2 3 4 5 6 7 8 9 10 10 0 -10 -20 -30 -40 -50 -60 0 -5 -10 -15 -20 -25 -30 -40 40S ribosomal proteins 60S ribosomal proteins Glycolysis and TCA Transcription factors HB NAM LOB MYB B3 AP2 ZF 1 2 3 4 5 6 7 1 2 3 4 1 2 3 1 2 3 1 2 3 1 2 3 1 2 3 4 5 6 7 8 9 10 11 12 13 10 0 -10 -20 -30 -40 D & D M Hormone-related 1 2 3 4 5 1 2 3 4 5 6 7 8 9 10 11 12 13 14 15 1 2 3 4 5 6 7 8 9 10 10 5 0 1 3 -5 -10 -15 -20 -25 -30 A Foldchange B Foldchange C Foldchange Supplementary Fig. 5
Supplementary Fig. 5 Expression of selected probes showing a different behaviour between the WT and 35S::BoSTM lines at stage 1 of Arabidopsis somatic embryogenesis. Up-regulation or down-regulation in WT embryos (compared to transformed embryos) is indicated by positive or negative values respectively. (A) Expression profiles of probes encoding ribosomal proteins and enzymes involved in glycolysis and TCA cycle. 1, Aconitase hydratase (At2g0510); 2, Malate dehydrogenase (At1g04410); 3, Malate dehydrogenase (At2g22780); 4, Pyruvate dehydrogenase (At5g50850); 5, Pyruvate kinase (At5g52920); 6, Phosphoglycerate mutase (At4g38370); 7, Fructose bisphosphate aldolase (At2g01140); 8, Fructose bisphosphate aldolase (At3g52930); 9, Phosphofructokinase (At1g12000); 10, triosephosphate isomerise (At2g21170). (B) Expression behaviour of probes encoding transcription factors. Homeodomain-containing (HB) proteins: 1 KNAT5 (At4g32040); 2 Homeobox-leucine zipper (At1g52150); 3, BEL1-like homeodemain protein (At1g19700); 4, HAT14 (At5g06710); 5, HB9 At1g30490; 6, WUSCHEL (At2g17950); 7, REVOLUTA (At5g60690). NAM-containing probes: 1, RD26 (At4g27410); 2, NAM –similar to TIP (At4g35580); 3, similar to NAC2 (At3g10500); 4, similar to NAC2 (At3g10490). Lateral Organ Boundary (LOB) class: 1, LBD12 (At2g30130); 2, LBD16 (At2g42430); 3, LBD41 (At3g02550). Myb-containing (MYB) probes: 1, myb transcription factor (At2g38300); 2, MYB32 (At4g34990); 3, MYB91 (At4g32010). B3-containing probes: 1, B3 family protein (At5g1800); 2, B3 family protein (At4g30080); 3, low similarity to FUSCA (At4g32010). AP2-containing probes: 1, RAP 2.2. (At3g14230); 2 and 3, AP2-containing proteins (At4g23750 and At1g36060). Putative transcription factors with zinc finger (ZF) motives: 1, (At2g24790); 2 (At1g75540); 3, (At3g10810); 4, (At5g01960); 5, (At3g19910); 6, (At5g01960); 7, (At2g19810); 8, (At3g02830); 9, (At4g36620); 10, (At4g32890); 11, (At3g54810); 12, (At5g25830); 13, (At4g24470). (C) Expression of probes involved in disease and defence (D&D), Metabolism (M), and Hormone-related responses. D&D: 1, Superoxide dismutase [Cu-Zn] (At1g08830); 2, Superoxide dismutase [Fe] (At5g23310); 3, Superoxide dismutase [Mn] (At3g10920); 4, Ascorbate peroxidase 1 (APX1) (At1g07890); 5, L-ascorbate peroxidise (APX) (At4g08390). Metabolism (M): 1, Sucrose-phosphatase 2 (SPP2) (At3g52340); 2, Sucrose synthase (At5g49190); 3, Mannitol dehydrogenase (At4g39330); 4, Galactose dehydrogenase (At4g33670); 5, Ribose-5-phosphate isomerase-related (At5g44520); 6, Glutamate synthase (At5g53460); 7, Glutamine synthetase (GS1) (At3g17820); 8, Glutamine synthetase, putative (At1g48470); 9, Glutamine synthetase, putative (At5g37600); 10, Glutathione synthetase (GSH2) (At5g27380); 11, S-adenosylmethionine synthetase (At1g02500); 12, S-adenosylmethionine-sterol-C-methyltransferase (At1g20330); 13, Nitrate reductase (At1g 77760); 14, Nitrate reductase 2 (At1g37130); 15, Nitrate-responsive NPOI protein (At5g40645). Hormone-related probes: 1, 1-Aminocyclopropane 1-carboxylate synthase (At4g37770); 2, Gibberellin-responsive modulator (At3g03450); 3, Gibberellin-regulated family protein (At5g14920); 4, Auxin-responsive GH3 protein (At5g54510); 5, Auxin-responsive protein (At3g23050); 6, Auxin-responsive protein (At2g22670); 7, Auxin-responsive protein (At5g65670); 8, Ethylene responsive element binding factor (ERF3) (At1g50640); 9, Ethylene responsive transcriptional co-activator (At3g24500); 10, Brassinosteroid signaling positive regulator (BZR1) (At1g75080).
80 60 Microarray 40 Foldchange ratio (35S:BoSTM / WT) qRT-PCR 20 0 -20 1 2 3 4 5 6 7 8 9 10 gene Supplementary Fig. 6 Supplementary Fig. 6. Validation of microarray experiments by quantitative RT-PCR. The expression level of ten genes was compared using the microarray data and quantitative qRT-PCR analyses. Values + SE (n=3) are expressed as foldchange ratios (35S::BoSTM / WT). Measurements were performed at the following stages of Arabidopsis somatic embryogenesis: stage 0 (gene 1 and 2); stage 1 (genes 3-6); stage 2 (genes 7, 8); stage 3 (genes 9, 10). List of genes used: 1, Oxidoreductase (At4g10500); 2, Cell division protein (At1g78770); 3, Leucin-rich repeat (At4g29240); 4, Short chain dehydrogenase (At3g12800); 5, S-adenosylmethionine synthase (At1g02500); 6, Ketol-acid reductoisomerase (At3g58610); 7, Peroxidase (At4g26010); 8, Zinc finger protein (At5g58580); 9, Male sterility MS5 (At5g4885); 10, DNA helicase (At1g60930). See supplementary Table 1 for sets of primers. The relative level of gene expression was analyzed with the 2 -∆∆CT method described by Livak and Schmittgen (2001) using actin (AY139999) as an internal reference.