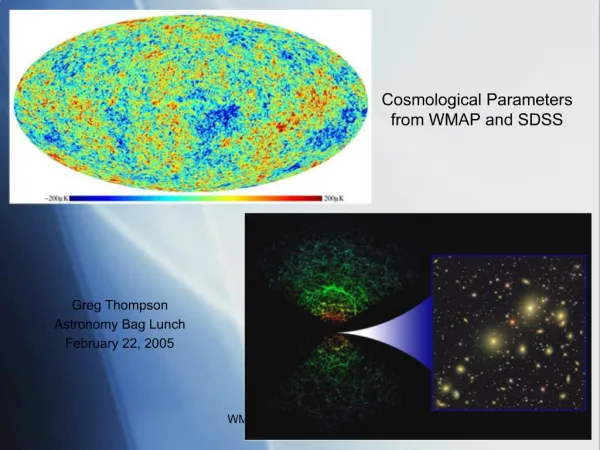
Cosmological Inference from Imaging Surveys: Understanding Weak Lensing Effects
220 likes | 338 Views
This study explores the implications of weak gravitational lensing on astrophysical observations, focusing on the measurement of shear and magnification effects on galaxy shapes. With assumptions of uncorrelated intrinsic galaxy shapes, the research addresses challenges in galaxy shape measurement, statistical errors, and the Point Spread Function (PSF) deconvolution. Further, it discusses prospects from the Large Synoptic Survey Telescope (LSST) in enhancing our understanding of cosmological parameters, dark energy, and modified gravity through the analysis of extensive imaging data from billions of galaxies.

Cosmological Inference from Imaging Surveys: Understanding Weak Lensing Effects
E N D
Presentation Transcript
Cosmological Inference from Imaging Surveys Bhuvnesh Jain University of Pennsylvania
Magnification and Shear Magnification Shear The effect of lensing on an initially circular source
Weak Lensing Overview • Lensing signal: 0.1-10% shear of galaxy images • Basic assumption of weak lensing: • Intrinsic galaxy shapes are uncorrelated, so average shape is round. • Statistical errors: • Each individual galaxy has ellipticity of about 30% • So error on shear estimate is ~0.3/(N1/2)
Challenges in Lensing Cosmology • Galaxy Shape Measurement • PSF “Deconvolution” of galaxy images • Shear Correlations and Covariances • Estimation of Cosmological Parameters • What are the interesting cosmological questions?
1 Mpc/h 500 kpc/h 100 kpc/h
Simulated Galaxy Cluster Image High Noise Low Noise Stars + Bkgd Gals Stars + Bkgd Gals Stars + Bkgd AND FrgndGals Stars + Bkgd AND FrgndGals
Low and High S/N Galaxies From Great08 Simulations, S. Bridle
Galaxy Shape Measurement • Star-Galaxy identification • Measurement of the Point Spread Function (PSF) • The true shape of every galaxy is convolved by the PSF. • The larger the seeing disc, the more blurred the galaxy image. This reduces the measured ellipticity. • The PSF is also generally anisotropic: this biases the measured ellipticity • Interpolation of the Point Spread Function • Measurement of “deconvolved” galaxy shape
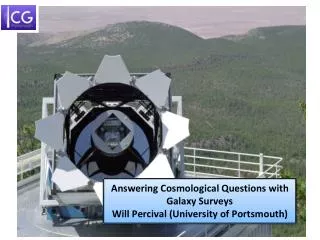
Prospects for LSST • Full (visible) sky surveyed every few days. • 9.6 square degree f.o.v. • 39 second cadence for 2 images per location. • 3 GPix per exposure. (15 Tbytes generated per night.) • Total area ~ 20,000 square degrees. • Expected ~ 2 billion usable galaxies. • Useful Range: 19 < m < 27 (r band). • 6 colors will give photometric redshifts for 0 < z < 3.
Galaxy shape measurement • For each of ~1 billion galaxies, “deconvolve” 1000 instances of galaxy shape (Nexposure x Nfilter) • PSF measurement and deconvolution algorithms are research areas. Computer science community getting involved via GREAT2008 and GREAT2010 challenges. • Goal: unbiased measurement of weighted quadrupole moment.
Overview Measure PSF at star positions Database Database Interpolate PSF Measure shears
Measure PSF at star positions Object catalogue from coadds All S/N>5 Single Boolean per object Identify Stars Star catalogue Images PSF coeffs (per star) Get PSF coefficients Shapelets 30 floating point #s 120 Bytes per star
Shear measurement Object catalogue All S/N>5 Shears per object Best Per filter Per exposure Errors on above Flags on the above (Also output shapelet descriptions of galaxies.) Images Shear measurement Parameters of PSF Interpolation
Shear correlations: current measurements • Aperture Mass Statistic: • Blue = E-mode • Red = B-mode • B-mode is well below 1-sigma error bars.
Lensing power spectrum The theorists version of a future lensing measurement. With LSST we expect >100 such spectra and cross-spectra. Takada & Jain 2004
Correlations and Covariances Lensing power spectra will be measured over ~100 bins in angular scale and ~10 bins in redshift. The calculation of covariances is feasible as it requires inversion of matrices of order 10,000x10,000. However with LSST era surveys, rapidly reach exascale proportions: with 100 bins each in redshift and lengthscale, one has 5x50,000x100~2.5 million binned spectra! So calculation and inversion of covariances, common to the analysis of all clustering probes, will requires major algorithmic and computational advances. Or “physically motiavated” shortcuts. For higher order correlations this problem is significantly harder.
What are the cosmological questions? • Parameterization of dark energy and modified gravity is not driven by theoretical models. • Dark energy: equation of state w (=-1?) • Modified gravity: Gravitational “constant”: G/Gnewton(=1?) and ratio of metric potentials / (=1?) • Null tests for General Relativity CDM can be defined. • But discovery of alternatives is hampered by lack of well motivated models. There is no meaningful metric in the space of model parameters. • Empirically motivated questions: • what is the best redshift range for probing dark energy? • Over what scales and redshifts does a survey probe gravity?
Survey driven science • We don’t know anything about dark energy if it’s not . • Given method from a give survey has principal components in measurement of w. (Fewer than 5 will be measured in the coming decade. ) • Modified gravity has time and scale-dependent parameters. Ongoing research on meaningful parameterization. • Will we be able to test for both dark energy and modified gravity?
A. Galaxies: r~1-10 kpc = = 0.98+/-0.07 from SLACS Einstein Rings + velocity dispersion Bolton et al 2006; Remodeling of the dynamics, in preparation!
Probes of metric potentials bulk flows Galaxies Galaxy Clusters Linear regime LSS • Dynamical probes (blue) measure Newtonian potential • Lensing and ISW (red) measures • Constraints from current data are at 10-50% level (w/ Guzik & Zhang, in prep.)
In the five year time-scale, Stage III imaging surveys will provide auto- and cross-spectra (at least 5) for lensing and angular clustering. These power spectra can be binned in at least 10 bins each in redshift and angular scale. Counting all cross-spectra in redshift bins, we have at least 5x50x10~2500 binned spectra. Thus the calculation of covariances is feasible as it requires inversion of matrices of order 10,000x10,000. However with Stage IV surveys, we must consider finer measurements in both redshift and angular scale. This problem rapidly reaches exascale proportions: with 100 bins each in redshift and lengthscale, one has 5x50,000x100~2.5 million binned spectra! So calculation and inversion of covariances, common to the analysis of all clustering probes, will requires major algorithmic and computational advances. For higher order correlations this problem is significantly harder. Beyond two-point statistics, higher order correlations scale naively as Nk where k is the order of the correlation function. For current data sets 3-point statistics have been measured on 50-100,000 sources in 10,000 CPU hours (to estimate the covariance of these measures requires multiple realizations of these or simulated data sets). Scaling to the size of angular surveys in BAO and lensing surveys and to 4 and higher order statistics is out of the range of current computational facilities. To achieve these orders requires not just new computational resources but also the development of approximation techniques where the accuracy of the measure is limited by the desired accuracy on the physical cosmological rather than the underlying shot noise.
The simultaneous estimation of cosmological parameters, small-scale physics and systematic uncertainties in the measurement (such as shear calibration errors in lensing) or model (scale and redshift dependent biases of galaxies) is essential in making rigorous dark energy measurements. So far the estimation of systematic uncertainties has been done using approximate models, but upcoming surveys offer the opportunity to estimate them from the data with minimal assumptions. This however requires the ability to carry out the equivalent of Monte Carlo Markov Chain parameter estimation over parameter spaces of very high dimension. Current analyses work with order 5D parameter spaces. Even with Stage III surveys, the goal will be to fit for up to 10 cosmological parameters and order 100 “nuisance” parameters: a computational challenge that requires vast increases in computational power and new algorithms. The number of nuisance parameters would be even larger depending on one’s degree of conservatism and with Stage IV surveys.