Download
1 / 18
180 likes | 240 Views
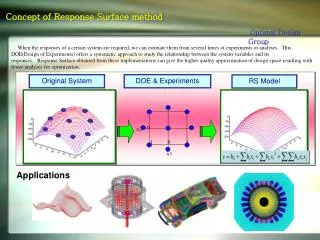
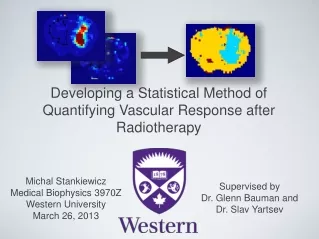
This research aims to develop a statistical method to analyze vascular response in glioma tumors post-radiotherapy, crucial for brain cancer survival. The study uses CT perfusion scans to quantify physiological changes, enhancing treatment outcome prediction.

E N D
Developing a Statistical Method of Quantifying Vascular Response after Radiotherapy Supervised by Dr. Glenn Bauman and Dr. Slav Yartsev Michal Stankiewicz Medical Biophysics 3970Z Western University March 26, 2013
Purpose and Motivation • Brain Cancer Survival • Radiotherapy technology • Vascular response after radiotherapy on glioma tumours • CT perfusions scans before and after radiotherapy • Physiological information Coleman. M.P, et al, Trends and socioeconomic inequalities in cancer survival in England and Wales up to 2001. Br J Cancer, 2004. 90(7): p.1367-73.
Purpose and Motivation • Highly heterogeneous after treatment • Averaging response may not show a difference • Waste of data Pre • Parametric Response Map (PRM) • Voxel-by-voxel analysis • Good predictor of patient survival Post Galbán C.J., Ross B.D., et al. Nat Med, 2009;15(5):572-576
Statistically quantifying voxels • increased or decreased based on threshold • tumour region of interest Objective
Tumour regions will show lower vascular function after radiotherapy • Blood volume • Blood flow • Permeability-surface area product (PS) Hypothesis
How CT Perfusion Works • Tracer kinetics • Iodinated contrast agent injected • Serial CT images of each section • Subtraction of baseline intensity • Time-enhancement curve for each pixel Courtesy of Timothy Yeung Lee, T. Trends in Biotechnology, 2002;20(8):S3-S10
TDC Example Courtesy of Timothy Yeung
Parametric Maps Blood Flow Blood Volume PS Pre Post
Methods • Contour normal brain
Methods - = Pre Post Difference map for PS (Pre - Post) • Upper and lower thresholds • Using pre treatment image to contour tumour ROI
Results BV difference in normal brain Lower 5th percentile Upper 95th percentile
Results Increased PS No difference Decreased PS Parametric response map of PS • Showing pixels that significantly decreased, increased and no difference in PS
Results Response: Decreased PS in tumour ROI Response: Increased PS in tumour ROI No difference in tumour ROI response
Responses PS Response Pre Map Post Map PRM SRS14 Decrease SRS12 No change Increase D4
Future Work • Repeat for blood volume and flow • Peri-tumoural region Pre Post