Download
1 / 18
180 likes | 267 Views
Learn how microarray technology works, its importance, sources of variation, and methods for analyzing gene expression in evolutionary research. Discover the challenges and benefits of using microarrays in functional genomics studies.

E N D
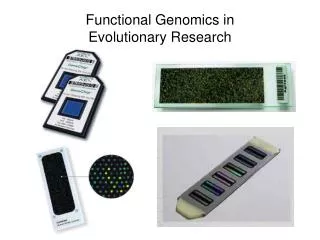
What Is Microarray Technology? High throughput method for measuring simultaneously, mRNA abundances for thousands of genes. Thousands of probes or features adhered to a solid substrate at known x,y coordinates. Probes: Spotted cDNA ~ 200 bp Oligo = 25 to 60 bp
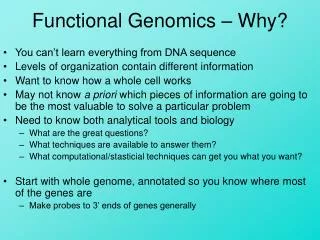
Why Is Microarray Technology Important? From NSF Program Announcement: Environmental Genomics
How Do Microarrays Work? Hybridization Technique - RNA targets isolated from a cell line or tissue of interest are labeled and hybridized to the probes. - Label intensity at a given location on the substrate correlates with the amount of target for a given mRNA (gene) present in the sample. Differentially expressed Genes: Identified statistically (e.g. t-test) by comparing control vs experimental.
The Burden of Multiple Testing A given microarray may have over 40,000 probes!!! This means that you may run as many as 40,000 statistical tests. If you reject a null hypothesis when P < 0.05, then 5% of the time you are rejecting true null hypotheses. If you run 40,000 tests, then by chance alone you will reject ~ 40,000 x 0.05 = 2000 true null hypotheses (i.e., you will have ~ 2000 false positives)
Biological (1) Experimental Treatments (2) Individual variance... may or may not be good (3) Nonspecific hybridization Paralogs of gene families Technical (Bad) (1) RNA quality (2) Dye biases (3) Stochasticity during scanning, image processing (5) Errors during probe synthesis or deposition (6) Stochasticity in labeling targets Sources of Variation in Microarray Experiments
Metamorphic Life Cycle (1) Sample tissue from 15 time points (x), including an early reference (R) time point. (7)Verify results by rt-PCR and analyze candidates in thyroid hormone-induced paedomorphs. Larval Adult Metamorphosis R x x x x x x x x x x x x x x (2) Compare expression for each time point and the reference on a DNA chip. x x x x x x R x x x x x x x x Larval Adult Metamorphosis? (6) Compare gene expression profiles among life cycles and tissues to identify differentially expressed genes. Paedomorphic Life Cycle (3) Quantify relative expression of each gene across all DNA chips. (2 life cycles x 3 tissues x 14 timepoints) (4) Model gene expression to determine how genes are expressed temporally within life cycle cycles for each tissue. What gene expression changes are associated with the evolution of paedomorphosis? Example Design
Visualization & Categorization Can be done for genes and/or arrays... Options Include a variety of multivariate and pattern matching techniques including the methodologies listed below Quadratic Regression Principal Component Analysis ClusteringHeat maps Liu et al. 2005... From the Stromberg Group here at UK
Gene Ontology & Biological Relevance • Microarray datasets can be overwhelming because they contain A LOT of information • Even experts on a system can be overwhelmed by the number of genes that are differentially regulated in some experiments • Having a standardized nomenclature that places a gene into one or more biological contexts can be invaluable for functional grouping (previous grouping techniques were irrespective of biological information) Gene Ontology is a standardized hierarchical nomenclature that classifies genes under three broad categories
Example of a Functional Genomics Study Molecular Ecology 2006 15, 4635-4643
Drosophila • Most species are very poor ecological model organisms. • D. mojavensis is cactophilic: it uses 4 different kinds of cactus host in the Sonoran Desert. • Oviposits in necrotic tissues, exposing larvae to varied toxic chemicals.
Objective • Identify gene expression differences of 3rd instar • larvae reared between two chemically distinct • cactus hosts: • Agria (Stenocereus gummosus), native host • Organpipe (Stenocereus thurberi), alternative host • Used a custom microarray (6520 anonymous • cDNA fragments that were pinned robotically • to glass slides)
Organpipe vs Agria Cacti • Differ in lipids, triterpenes, and glycosides. • Differ in alcohol content. • Adh is duplicated in D. mojavensis and • The paralogs are known to play different • roles in host adaptation.
Mixed Model Anova Approach Relative hybridization Intensity 1) = Random Technical and Residual Variation Yij = µ + ARRAYi + DYEj + ARRAY × DYEij + Residualij Residual Variation Per Gene 2) = Random Technical and Fixed Technical and Biological Variation Residualijkl = µ + ARRAYi + DYEj + CACTUS + ARRAY x Spotil + Errorijkl
Correcting for Multiple Tests Bonferroni correction: More conservative test where the significance threshold is divided by the total number of tests. False Discovery Rate (FDR): Less conservative test that calculates the number of false positives within a set of significant values (P<0.05) and then calculates a new significance threshold , q.
Identifying Differentially Expressed Genes Greater Expression Organpipe Greater Expression Agria P value for Each Gene Specific Anova -log(P) Bonferroni (173) False Discovery Rate (1034) Fold Difference Log2
Representation of Up-regulated Genes Among Gene Ontology Categories.
Conclusions (i) Cactus host usage affects patterns of gene transcription. (ii) Loci whose function involve detoxification were differentially regulated in response to a cactus host shift. (iii) A subset of the differentially expressed loci may have arisen de novo in the D. mojavensis lineage.