Download

1 / 9
90 likes | 174 Views
Detailed analysis of Maumee River environmental trends including temperature, precipitation, storm runoff, water quality, and nutrient loads over 50 years. Significant increases in temperature and storm discharge observed. Sponsored by NSF, NOAA, Ohio EPA, and others.

E N D
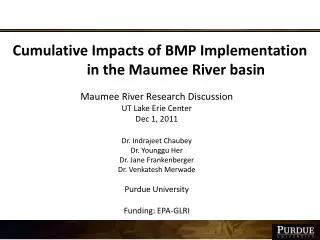
Maumee Trends Pete Richards Heidelberg University
Temperature and Precip at Toledo Airport (1960-2010) • Statistically significant increases: • Temperature increase of 1.87°C, 2.32°C in winter, 2.71°C in winter Tmin • Precipitation increase of 0.41 mm
Maumee Storm Runoff Statistics (1960-2010) • Statistically significant increases: • Number of storm runoff events per year (67% increase) • Number of spring runoff events (40%) • Number of winter runoff events (47%) • Annual storm discharge (53%) • Summer storm discharge (27%) • Other seasonal comparisons show increases but not significant ones • Rapid increases 1960-1970, slower increases since
Top third Bottom third Maumee Loads Last Five Years • Several Big Loading Years • Ranks of each year’s load (out of 34 years)
Maumee Loads Last Five Years • Spring (April-June) DRP loads in 2010 and 2011 each were record-breakers
Conclusion • Almost everything is going up! Support: NSF Water Sustainability and Climate Grant #1039043 NOAA-CSCOR Grant #NA07OAR432000 State of Ohio EPA Great Lakes National Program Office The Andersons The Fertilizer Institute USDA Natural Resources Conservation Service