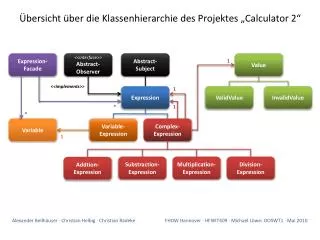

Analysis of H3K4me2 Gene Expression Profiles in CD4+ T Cells
E N D
Presentation Transcript
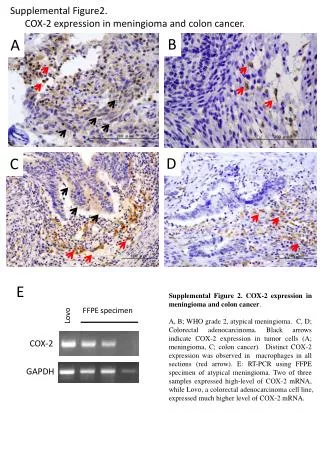
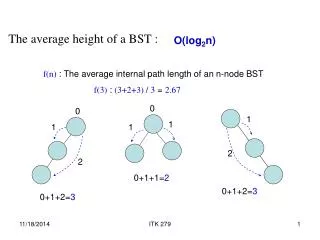
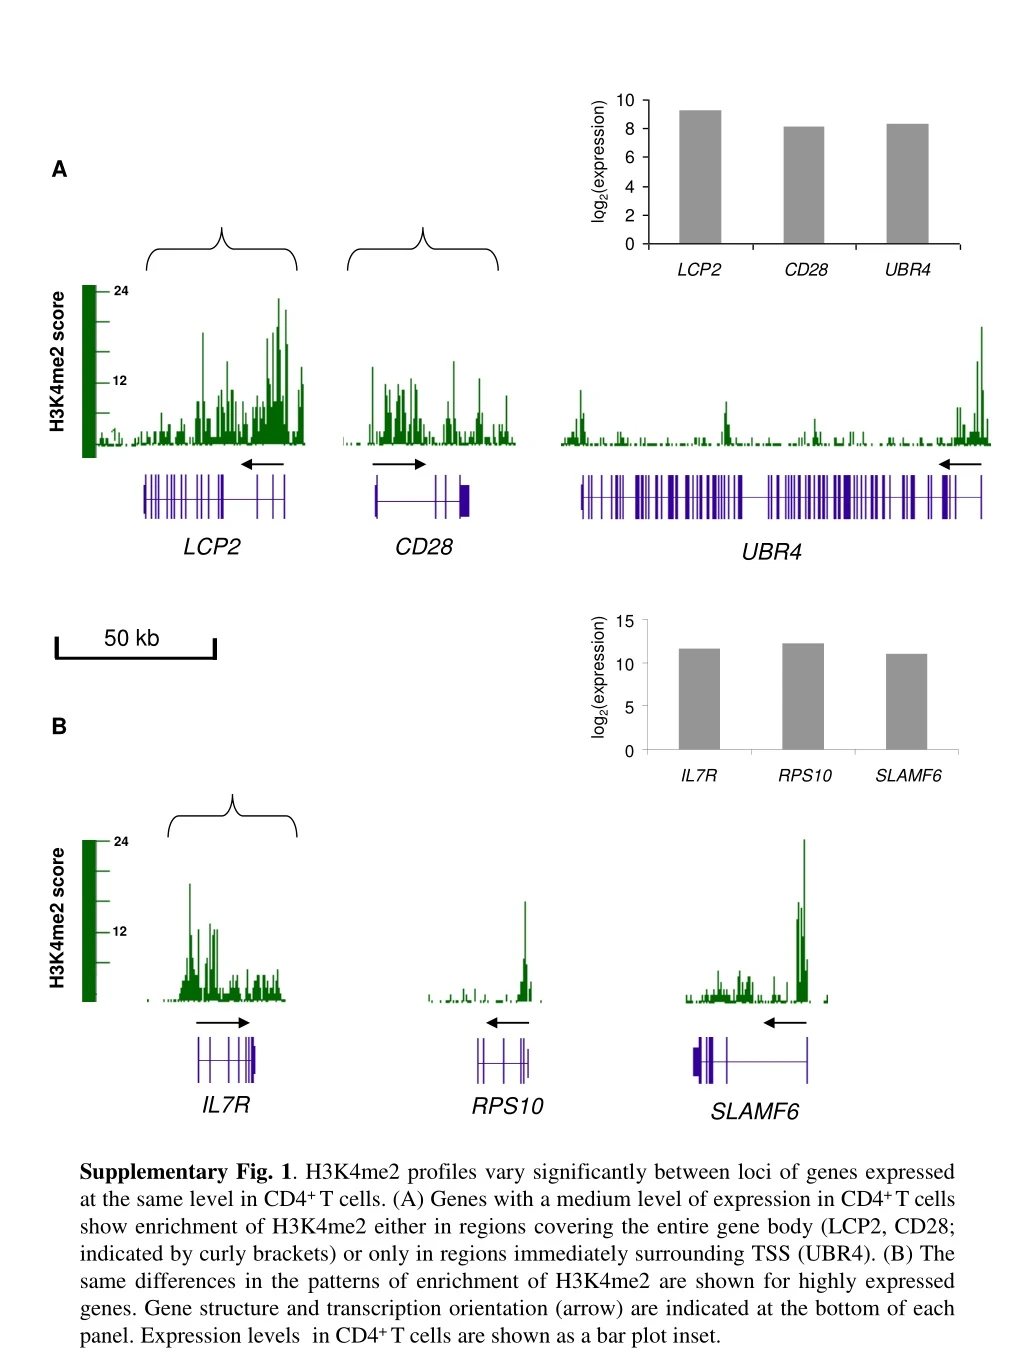
15 10 5 0 IL7R RPS10 SLAMF6 log2(expression) A 24 H3K4me2 score 12 LCP2 CD28 UBR4 50 kb log2(expression) log2(expression) B 24 H3K4me2 score 12 IL7R RPS10 SLAMF6 Supplementary Fig. 1. H3K4me2 profiles vary significantly between loci of genes expressed at the same level in CD4+ T cells. (A) Genes with a medium level of expression in CD4+ T cells show enrichment of H3K4me2 either in regions covering the entire gene body (LCP2, CD28; indicated by curly brackets) or only in regions immediately surrounding TSS (UBR4). (B) The same differences in the patterns of enrichment of H3K4me2 are shown for highly expressed genes. Gene structure and transcription orientation (arrow) are indicated at the bottom of each panel. Expression levels in CD4+ T cells are shown as a bar plot inset.
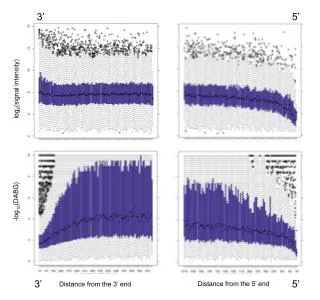
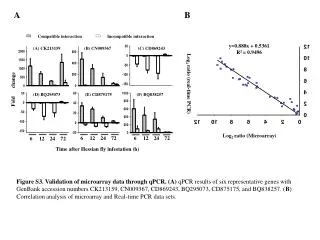
A B log2(expression) 7 7.5 8 8.5 9 9.5 10 Control genes Cluster 1 Cluster 1 Control genes Average tag count Distance from TSS (base pair) Supplementary Fig. 2. Average profiles of H3K4me2 in the function of gene expression. (A) Average profiles of H3K4me2 for cluster 1 (dotted red line) in comparison to mean profiles for genes in distinct deciles (dec.) of expression. Genes within cluster 1 show a substantially higher level of H3K4me2 in the gene body. (B) Comparison of the average H3K4me2 profile of cluster 1 with the average H3K4me2 profile of genes within the same range of expression as genes from cluster 1 (Box plot inset), further indicating the independence of the observed pattern of enrichment on the level of expression. Notably, no substantial difference in the level of H3K4me2 immediately before the TSS was observed (arrow).
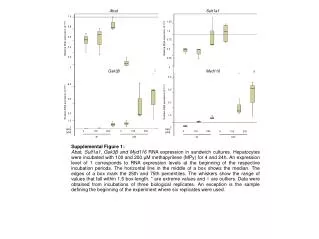
log2(expression) A g C1 Ag C1 Ag C1 Ag C1 Ranges of expression 1 2 3 4 Supplementary Fig. 3. Box plots showing the expression level of all genes (All g.; grey color) and genes from cluster 1 (Cl 1; red color) in four defined ranges of expression as measured by transcriptome study.
Pol II H3K4me1 H3K4me3 H4K20me1 H4K20me3 H3K79me1 H3K79me2 H3K79me3 H3K36me1 H3K36me3 H3K27me1 H3K27me2 H3K27me3 H3R2me1 H3R2me2 H3K9me1 H3K9me2 H3K9me3 H2BK5me1 H2AZ Average tag count H2AK5ac H2BK12ac H2BK5ac H2BK120ac H2BK20ac H3K4ac H3K9ac H3K14ac H3K18ac H3K23ac H3K27ac H3K36ac H4K5ac H4K16ac H4K8ac Distance from TSS (kb) Supplementary Fig. 4. Average profiles of all analyzed epigenetic features for genes within distinct H3K4me2 clusters.
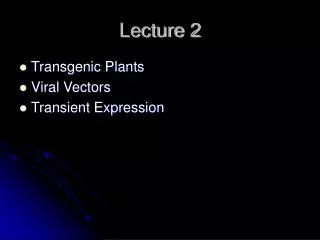
Clusters 1 2 3 4 5 A H3K9me1 Cluster 1 Cluster 2 Cluster 3 Cluster 4 Cluster 5 Average tag count Distance from TSS (kb) B C Cluster 5 Cluster 4 Tissue specificity index Cluster 1 Cluster 3 Cluster 2 H3K4me2 Cluster 1 H3K9me1 Cluster 1 D 89 302 246 Supplementary Fig. 5. Independent clustering of H3K9me1 ChIP-Seq signals. Average profiles of five H3K9me1 clusters (A). (B) Box plots showing per gene calculations of the net number of tissues per gene (i.e. T cell specificity index), for which, a difference of expression (between a given tissue and CD4+ T cells) was statistically significant (Benjamini Hochberg adjusted p-val. < 0.05; moderated T-test). (C) Pie plot showing the distribution of CD4+ T-cell specific genes within the five H3K9me1 clusters. (D) Venn diagram showing the overlap between genes found within H3K4me2 cluster 1 and H3K9me1 cluster 1.
*** *** *** *** A B * gene length (bp) * ** *** Clusters 1 2 3 4 5 Clusters 1 2 3 4 5 C D 1st intron length (bp) *** *** *** *** conserved TFBS/gene putative cis-regulatory elements/gene 1 2 3 4 5 Clusters 1 2 3 4 5 Clusters Supplementary Fig. 6. Box plots showing the length of first intron (A), gene length (B), the number of conserved transcription factor binding sites (TFBS) (C) and the number of putative cis-regulatory elements (D) found for analyzed intragenic regions of genes in different H3K4me2 clusters. Genes within cluster 1 have a significantly longer first intron without showing an overall significant difference in the gene length (two sided t.test), a statistically higher number of intragenic (TSS to + 8 kb) and conserved TFBS, and are associated with high numbers of intragenic (TSS to + 8 kb) putative cis-regulatory elements (* p val. < 0.05, ** p val. <0.001, *** p val.< 0.0001).
Clusters 1 2 3 4 5 Number of DHSS/gene (n=63) (n=17) (n=16) (n=17) (n=19) Supplementary Fig. 7. Box plots showing the number of DHSS found in regions from -2 kb to +8 kb around TSS for highly T cell specific genes in the function of their distribution to distinct H3K4me2 clusters. Gene numbers are shown in parentheses.
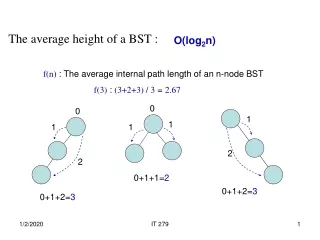
A B 0 10 30 Cluster 1 Cluster 1 (704 genes) Cluster 2 Cluster 3 Cluster 4 Cluster 5 Cluster 2 (1130 genes) Average tag count Cluster 3 (1417 genes) Distance from TSS (kb) C 0.021 Cluster 4 (2025 genes) < 0.0001 < 0.0001 < 0.0001 log2(expression) Cluster 5 (3153 genes) Genes 1 2 3 4 5 Clusters -2 +8 0 Distance from TSS (kb) Supplementary Fig. 8. For description see next page.
D 10-16 0.0042 0.47 10-5 10-14 *** ** *** *** log2(expression) WB other WB other WB other WB other WB other Clusters 1 2 3 4 5 E F Cluster 5 Tissue specificity index Cluster 1 Cluster 4 Cluster 3 Cluster 2 1 2 3 4 5 Clusters Supplementary Fig. 8. Clustering of H3K4me2 ChIP-Seq profiles for mouse whole brain. (A) K-means clustering of H3K4me2 profiles in whole brain tissue in regions from -2 to +8 kb around the TSS. (B) Average profiles of H3K4me2 for genes within the five identified clusters. (C) Box plots showing the level of expression of genes identified in the different H3K4me2 clusters in brain tissues.(D) Genes within cluster 1 are preferentially expressed in brain. Box plots showing the comparison between levels of gene expression of genes from different H3K4me2 clusters in brain tissues cells and the mean level of expression calculated across all other tissues (** p-val < 0.005, *** p-val < 0.0005; Man Whitney test; other: other tissues). (E) Box plots showing per gene calculations of the tissue specificity index, (F) Pie plot showing the distribution of brain specific genes within the five H3K4me2 clusters
Cluster 1 Complete set Frequency CpG Observed vs. expected Supplementary Fig. 9. Histograms showing the distribution of CpG observed versus expected ratios for genes within cluster 1 (red colour) and all genes included in the study (Complete set; blue colour).
*** *** *** *** # of DHSS Cluster 1 Cluster 2 Cluster3 Cluster 4 Cluster 5 Supplementary Fig. 10. Box plot showing the number of distal intergenic DHSS associated to genes within distinct H3K4me2 clusters. DHSS found around 50 kb of each gene, but excluding the gene body, were selected (*** p val.< 0.0001).