1 / 1

Probing Gene Expression: Analyzing .3’.5’.log2(Signal Intensity) and -log10(DABG)

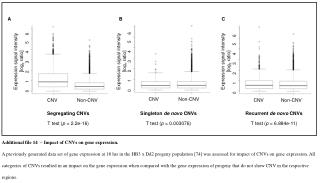
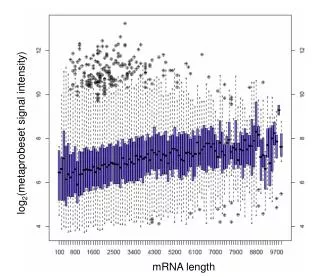
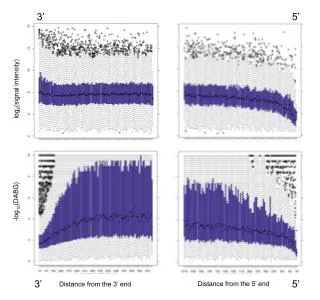
Delve into gene expression dynamics using .3’.5’.log2(signal intensity) and -log10(DABG) metrics to study distance from the 5’ and 3’ ends. Discover insights into gene expression patterns with this advanced analytical approach.

julius
Download Presentation

Probing Gene Expression: Analyzing .3’.5’.log2(Signal Intensity) and -log10(DABG)

An Image/Link below is provided (as is) to download presentation Download Policy: Content on the Website is provided to you AS IS for your information and personal use and may not be sold / licensed / shared on other websites without getting consent from its author. Content is provided to you AS IS for your information and personal use only. Download presentation by click this link. While downloading, if for some reason you are not able to download a presentation, the publisher may have deleted the file from their server. During download, if you can't get a presentation, the file might be deleted by the publisher.

E N D

Presentation Transcript


  1. 3’ 5’ log2(signal intensity) -log10(DABG) 5’ 3’ Distance from the 5’ end Distance from the 3’ end

More Related