Download
1 / 11
110 likes | 299 Views
Namaste Project 3.4 GHz Interference Study Preliminary document - Work in Progress updated 05-29-08. The intent of this study is to collect data which may be used to help determine the noise floor expected to be received by a typical 3.4 GHz Namaste earth station from a satellite.

E N D
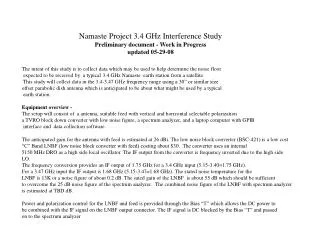
Namaste Project 3.4 GHz Interference Study Preliminary document - Work in Progress updated 05-29-08 The intent of this study is to collect data which may be used to help determine the noise floor expected to be received by a typical 3.4 GHz Namaste earth station from a satellite. This study will collect data in the 3.4-3.47 GHz frequency range using a 30” or similar size offset parabolic dish antenna which is anticipated to be about what might be used by a typical earth station. Equipment overview - The setup will consist of a antenna, suitable feed with vertical and horizontal selectable polarization a TVRO block down converter with low noise figure, a spectrum analyzer, and a laptop computer with GPIB interface and data collection software. The anticipated gain for the antenna with feed is estimated at 26 dBi. The low noise block converter (BSC-421) is a low cost “C” Band LNBF (low noise block converter with feed) costing about $30. The converter uses an internal 5150 MHz DRO as a high side local oscillator. The IF output from the converter is frequency inverted due to the high side LO. The frequency conversion provides an IF output of 1.75 GHz for a 3.4 GHz input (5.15-3.40=1.75 GHz). For a 3.47 GHz input the IF output is 1.68 GHz (5.15-3.47=1.68 GHz). The stated noise temperature for the LNBF is 13K or a noise figure of about 0.2 dB. The sated gain of the LNBF is about 55 dB which should be sufficient to overcome the 25 dB noise figure of the spectrum analyzer. The combined noise figure of the LNBF with spectrum analyzer is estimated at TBD dB. Power and polarization control for the LNBF and feed is provided through the Bias “T” which allows the DC power to be combined with the IF signal on the LNBF output connector. The IF signal is DC blocked by the Bias “T” and passed on to the spectrum analyzer
The spectrum analyzer will be set to capture the maximum signal amplitude detected within the 1.68-1.75 GHz IF range as the antenna is slowly moved to various positions and polarizations. A snapshot of the spectrum analyzer screen data will be either down loaded to a laptop computer using a GPIB interface or a digital camera may be used to take a picture of the spectrum analyzer screen. Sanity checks and calibration - Sun noise system test - Noise measurements: Spectrum analyzer set for 2 MHz RBW Cold sky = -62.2 dBm Earth = -59.3 dBm Sun ( cloudy) = -58.7 dBm Terrestrial weak signal test - This will be performed using a signal source of know amplitude and frequency connected to a antenna of known gain placed at a suitable distance from the equipment to be tested. This data should allow Antenna/feed optimization and overall system gain determination, approximate noise floor calibration and frequency calibration. Initial test results: Ant BW total between 3 dB points = 6 deg Spectrum analyzer set for 2 MHz RBW Beacon -20 dBm into dipole with reflector at 100’ Rx signal -5 dBm “C” band satellite signal measurement - TBD
Data collection procedure - The spectrum analyzer will be set as follows: Start frequency 1680 MHz Stop Frequency 1750 MHz RBW 100 KHz VBW 3 KHz Detector in sampled mode Max hold if needed A search for terrestrial interference with the antenna aimed at the horizon (0 deg elevation) is made rotating the antenna slowly over at least 360 degrees azimuth. If any signals are detected. Pointing will be done to maximize the signal and a screen capture made. The elevation will then be raised to see at what elevation the signal is diminished.
Data collection results to date 1. A horizon scan was made at La Mesa , Ca in front and back yard at N6IZW home. Found large signal due to 3rd harmonic of 1296 transverter LO of 1152 MHz located about 30 feet way. No other signals detected once transverter was turned off. 2. A horizon scan was made at home of K6QPV also in La Mesa over looking San Diego which is about 12 miles West. Detected signals about 10 dB above noise floor towards the West and captured using max hold as the signal appeared to be perhaps frequency hopping. There is considerable Navy activity in that direction. The interference dropped below the noise floor by the time the elevation was raised to about 8 deg.
Received signal Band 3.4-3.47 GHz 30” Offset Dish Antenna on Tripod IF Signal 1.75-1.68 GHz Low Noise Block Converter Bias “T” HP Spectrum Analyzer Power and IF Laptop with GPIB Controller GPIB 13V=VPOL 17.5V = HPOL Power & Polarity Control Unit 115VAC 60 Hz Notes: Est ant gain = 26 dB Down Conv. Gain = 55dB LO = 5150 MHz 3.4 GHz RF = 1.75 GHz IF 3.47 GHz RF = 1.68 GHz IF 12VDC to 115VAC Inverter 12V Battery or supply
Kerry, N6IZW performing C Band interference data collection at home of K6QPV
View West from home of K6QPV where interference was seen at horizon