Download
1 / 29
290 likes | 440 Views
Despeckle Filtering in Medical Ultrasound Imaging. Hairong Shi (1) Xingxing Wu (2). (1) Department of Medical Physics, University of Wisconsin-Madison (2) Department of Electrical and Computer Engineering, University of Wisconsin-Madison. Introduction.

E N D
Despeckle Filtering in Medical Ultrasound Imaging Hairong Shi (1) Xingxing Wu (2) (1) Department of Medical Physics, University of Wisconsin-Madison (2) Department of Electrical and Computer Engineering, University of Wisconsin-Madison
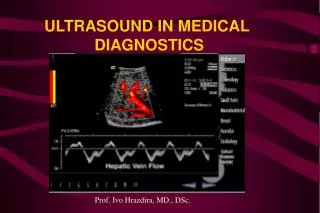
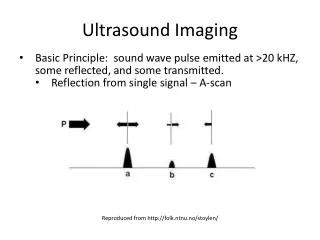
Introduction • The medical Ultrasound B-scan image is acquired by summation of the echo signals from locally correlated scatterers in beam range. • Locally correlated multiplicative noises from small scatterers corrupt ultrasound image. These noises are commonly called “speckles”. • In many cases the speckle noise degrades the fine details and edge definition, limits the contrast resolution, limits the detect ability of small, low contrast lesions in body. And it should be filtered out.
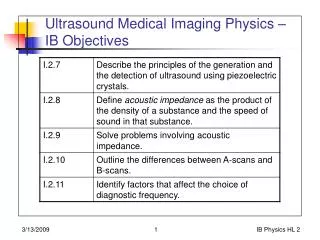
Noise Statistics • For research purpose,Radio-frequency (RF) data are collected. To show B-mode image, RF data are first envelope detected, and then logarithm compressed. • The multiplicative speckle is converted into additive noise after logarithm compression, the noise is spatially correlated, and has a Rayleigh amplitude PDF: • For fully developed speckle magnitude, the mean to standard deviation-pointwise SNR=1.9 (5.58dB)
Filtering Methods • In this project, we implement 4 filtering methods: • (1) Wiener Filter; • (2) Anisotropic Diffusion Filter; • (3) Wavelet Filter; • (4) Adaptive Filter;
Test Images We use the following test images to evaluate the performance of the filters. (1) 4 simulated inclusion phantoms with different contrast. Center frequency 3MHz, band width 40%, no attenuation. Contrast 10dB, 5dB, -5dB and -10dB.
Test Images (Cont’d) (2) An in-vitro B-mode image for a plaque from human carotid artery. The plaque is embedded in gelatin. From Aloka SSD2000 Medical Ultrasound system.
Method 1: Wiener Filter • Since the input filter g=1 in frequency domain, the Wiener filter is: • The power spectrum of the underlying image is modeled as: • Where σs2 can be replaced by the mean variance of the noised image σx2. μx and μy are frequency coordinators, the range is [-π, π).
Wiener Filter: Noise Power Spectrum The Power Spectrum of speckle pattern Sww is averaged from 12 simulated speckle patterns with image size 128*128.
Wiener Filter Results • The restored images by Wiener filter are excellent: • Most speckles are removed; • Inclusions are clearly seen. even for 5dB contrast cases • The background is uniform as we simulated. • The main reason is that the averaged power spectrum of the noise is very close to the noise power in the noised images, so we can restore images well. 10dB 5dB -5dB -10dB
Wiener Filter Results (Cont’d) Plaque Sample
Wiener Filter Results (Cont’d) • The power spectrum of simulated noise can be applied well onto the real B-mode images: • (1) The speckles are also removed efficiently • (2)The structure of the materials are restored. • There are still some speckles in restored images, which means the simulated noise power spectrum is not perfectly matched with the real ones. • The rest speckles can be removed by median filters. • The image qualities can be improved by unsharp mask and histogram stretch.
Method 2: Anisotropic Diffusion Filter • Anisotropic diffusion is an efficient nonlinear technique for simultaneously performing contrast enhancement and noise reduction. It smoothes homogeneous image regions and retains image edges. • The main concept of Anisotropic diffusion is diffusion coefficient. Perona and Malik (1990) proposed 2 options: • Or
Method 2: Anisotropic Diffusion Filter (Cont’d) • The anisotropic diffusion method can be iteratively applied to the output image: • Parameter k~[20,100], step sizeλ<=0.25.
Anisotropic Diffusion Results: • The anisotropic diffusion filter can restore noised image well: • Speckles are removed and inclusions show clearly. • In Anisotropic diffusion method, we don’t need know the noise pattern or power spectrum, this is the advantage over Wiener filter. • The anisotropic diffusion method needs more computation time than Wiener Filter method. • Parameter selection, iteration loop selection all affect the final results. 10dB 5dB -5dB -10dB
Anisotropic Diffusion Results: (Cont’d) Plaque Sample
Anisotropic Diffusion Results: (Cont’d) • The anisotropic diffusion method gives better contrast while removing speckles effectively. • In fact, because the parameters in anisotropic diffusion method are adjustable, we can control parameters and choose the best image.
Comparison of Image Profile Image profiles before and after Wiener filter, and anisotropic diffusion are plotted. Image becomes smoother after filtering.
Method 3: K-distribution Based Adaptive Filter • The K distribution model is a model for speckle statistics of ultrasound echo speckle. • The K distribution is a good model for the echo envelope signal statistics when the scatter number densities are low. • The model can accurately predict variations in the statistics with varying scatterer number.
K Distribution K distribution pdf The K distribution as a function of a
Adaptive filter for uncompressed images The restored image Y can be calculated by Where X is the original image, is the image averaged value
Adaptive filter for log-compressed images The restored image Y can be calculated by Where X is the original image, is the image averaged value. is the compensation coefficient.
Adaptive Filter results: Original image for 5dB inclusion phantom Image of 5dB inclusion Phantom after filtering
Adaptive Filter results: (Cont’d) • The filter can smooth image locally based on some local statistics. • This filter is easy to implement and the statistics is easy to estimate. • There is no need to find an optimal solution.
Method 4: Wavelet Filter • The wavelet techniques are widely used in the image processing, such as the image compression, image denoising. • The wavelet filter has good image processing performance. • We use thresholding method to despeckle.
Wavelet Filter Image decomposition Equation: Decomposed image
Wavelet Filter Results: Original image for Carotid Artery Plaque Image of plaque After filtering
Wavelet Filter Results: (Cont’d) Original image for 5dB inclusion phantom Image of 5dB inclusion Phantom after filtering
Comparison of Filter Performance To evaluate the performance of 4 different filters, we we take the same small region with pixel size 64*64, and calculate the mean-standard deviation ratio, i.e. pixel-wised SNR. • Wiener filter, Anisotropic diffusion filter and k distribution based adaptive filter improve the SNR. • Wavelet filter doesn’t improve the SNR very much.
Conclusion • The Wiener filter can improve the image qualities well and simulated power spectrum of speckle can be applied on many situations. • The Anisotropic diffusion filter can also despeckle well as long as we choose reasonable parameters, and it doesn’t need extra information of noise pattern. • The K-distribution based adaptive filter can improve the image quality, the method is easy to implement and the statistics is easy to estimate and characterize. • The wavelet filter is not highly suitable for removing the speckle in ultrasound images.