Download
1 / 33
330 likes | 412 Views
This presentation highlights the importance of finding budget for work management software. It discusses reasons why having the right tool to manage work efficiently is essential for success. The presentation covers statistics on budget overruns, poor planning, information overload, lost productivity, and the impact on project outcomes. It showcases the benefits of using a comprehensive work management solution like AtTask to improve visibility, streamline processes, and enhance productivity. Learn how investing in the right tool can lead to significant cost savings and better outcomes for your organization.

E N D
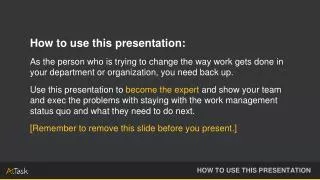
How to use this presentation: As the person who is trying to change the way work gets done in your department or organization, you need back up. Use this presentation to become the expert and show your team and exec the problems with staying with the work management status quo and what they need to do next. [Remember to remove this slide before you present.] How to Use this Presentation
4 Reasons We Need to Find Budget for Work Management software
Budgets are tight. At first glance, our numbers show we can’t afford to implement an enterprise work managementsolution. "If the only tool you have is a hammer, you tend to see every problem as a nail." —Abraham Maslow Introduction
The truth is … the data says otherwise. More than half of projects have at least two of: • Taking 180% of target time to deliver • Consuming 160% of estimated budget • Delivering under 70% of the target required functionality1 Introduction
This presentationwill show 4 sobering reasons why the right toolto manage our entire lifecycle of work, including projects, is not a luxury but a necessity. Introduction
Challenges We Face • Random Input Process • Inefficient Use of Time • Disconnected Activities and Tools • Low Tool Adoption • Poor Visibility (Work and Resources) Why should we care?
RANDOM INPUTS POOR VISIBILITY LATE OVER BUDGET INCOMPLETE/FAILED LOW PRODUCTIVITY This is Us
3 2 Why Should we care?
What is the definition of failure? • Work delivered late • Went over budget • Delivered minus requested features/functions Why Should we care?
What’s the result of failure? • Lost work leads to panic • Missed deadlines gets you angry stakeholders/customers • Costly, duplicated work ends up in finger pointing • Too many tools results in confusion and frustration • Unable to prioritize leads to fire drills Why should we care?
Would you like to see this improve on our team or in our department? “Change is vital, improvement the logical form of change.”—James Cash Penney Why Should we Care?
Data on projects shows the failure rate is increasing at 15% per year.4 • Only 2.5% of companies successfully completed 100% of their projects.5 Reason #1: Projects Over Budget and Behind Schedule
62% of projects overrun on time.5 • 49% of projects overrun on budget.6 • 47% of projects suffer from higher than expected maintenance costs.7 Reason #1: Projects are Over Budget and Behind Schedule
76% of companies say the biggest priority is to improve visibilityand awareness of projects across the organization.8 • 60% – 80% of project failures can be attributed to poor requirements gathering, analysis, and management9 Reason #2: Disconnected Tools for Planningand Visibility
25% – 40% of spending on projects is wasted as a result of re-work10 • Up to 80% of budgets are consumed fixing self-inflicted problems11 • 50% of projects are rolled back out of production12 Reason #2: Disconnected Tools for Planningand Visibility
Enterprise workers are drowning in information, only part of which is relevant or useful. • Information overload cost the U.S. economy almost $1 trillion in 2010.13 • 28 billion hours is lostannually to information overload.14 REASON #3: Information and Work Overload
66 percent of workers don't have enough time to get their work done.15 • 94 percent feel overwhelmed by information to the point of incapacitation.16 REASON #3: Information and Work Overload
100 emails can consume 50% of a worker’s day17 • This could cost our company more than $20,000 per person, per year • Based on an average salary of $42,979 in 2011 REASON #4: Lost Productivity (and $) to Email
For every 100 people who are unnecessarily copied on an e-mail, eight hours are lost.18 • A Fortune 500 company estimates this lost productivity has a yearly impact of $1 billion.19 REASON #4: Lost Productivity (and $) to Email
These 4 reasons show how important the right tool to manage all of our work will be. The right tool is one that solves each problem. Conclusion
The right tool is AtTask. Based on average licenses, users, and average time spent in AtTask managing work, the maximum payback period for the solution is five months. Conclusion
Customer Story Conclusion: Customer Story "The value is tremendous. Our best engineers are gaining 20 or 30 percent more time behind the CAD station, innovating. Our fill rates, our ability to see what’s going on in the supply chain and understand what our year’s going to look like,is worth millions of dollars to the company.” Steve Malchow VP of Operations, Engineering and Sourcing, Trek
TOTAL VISIBILITY SINGLE INPUT SUCCESS Conclusion
About AtTask In looking for genuine solutions to work lifecycle, and project management, stepping beyond “the way we’ve always done things” or scattered single-point, freemium, web-basedtools and toward a single enterprise work management solution, means greater productivity and project success. With AtTask Enterprise Work Cloud, improvements to planning, visibility, engagement, and productivity can be realized. Additionally, with strong ROI data, quick payback periods, and the ability to propel an enterprise closer to its strategic goals, you can make a robust business case for implementing this solution with key decision makers. Email info@attask.com or call 866.441.0001 to continue the conversation. Conclusion
What is a good day for me to schedule a demo for us? Conclusion
Sources 1 – Ellis, Keith, 2012. “Business Analysis Benchmark: The Impact of Business Requirements on the Success of Technology Projects” http://www.iag.biz/images/resources/iag%20business%20analysis%20benchmark%20-%20full%20report.pdf 2 – Humphrey, Watts S., 2005. The Software Engineering Institute. http://www.stsc.hill.af.mil/CrossTalk/2005/03/0503Humphrey.html 3, 4 – Sessions, Roger, 2009. “IT Complexity Crisis” http://www.objectwatch.com/whitepapers/ITComplexityWhitePaper.pdf 5 – PricewaterhouseCoopers Study, 2004.http://www.pwc.com/us/en/operations-management/assets/pwc-global-project-management-survey-first-survey-2004.pdf 6, 7 – TATA Consultancy Report, 2007. “IT Projects Experience Certainty” http://www.tcs.com/Insights/Documents/independant_markets_research_report.pdf 8 – Conspectus Survey, 2009. http://www.conspectus.com/2009/may/downloads/Conspectus_PPM&PSA_May09.pdf 9 – Meta Group Research. http://asapm.org/asapmag/articles/AdditionalConstraint.pdf 10 – Carnegie Mellon University, 2005. http://www.sei.cmu.edu/library/assets/tutorialmod3.pdf 11 – Dynamic Markets Limited Study, 2007. http://www.dynamicmarkets.co.uk/ 12 – Gartner Report. http://www.gartner.com/newsroom/ 13-19 – Spira, Jonathan B., 2011. “Overload! How too much information is hazardous to your organization” Sources