Download
1 / 28
290 likes | 407 Views
Test data exchange to support development of a biological indicators in rivers and lakes. Anne Lyche Solheim and Jannicke Moe , NIVA EEA European Topic Centre on Water EIONET meeting 20-21 October 200 9 , Copenhagen. Outline of presentation. Objective and process

E N D
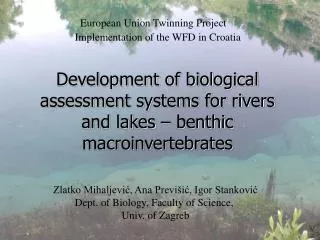
Test data exchange to support development ofa biological indicators in rivers and lakes Anne Lyche Solheim and Jannicke Moe, NIVA EEA European Topic Centre on Water EIONET meeting 20-21 October 2009, Copenhagen
Outline of presentation • Objective and process • Overview of replies (countries, water bodies, stations) • Data compilation and analyses • Results • Conclusions and way forward
Objective: Why biology now? • Current indicators only indicate pressures on water bodies • Biological indicators provide info on impacts of the pressures • Added value relative to what is already reported to Commission: • Provide status for each Biological Quality Element • Enable trend analyses (long-term) on numerical scale through normalisation of EQRs • Example of improvement: • change from EQR=0,45 to EQR=0,55 show approaches towards good status objective (EQR>0.6), although WB is still within the same class (moderate status) • Example of degradation: • change from EQR=0,75 to EQR=0,65 show increasing risk of failing good status (EQR>0.6), although WB is still within the same class (good status)
Calculation of normalised EQR values In order to allow comparison of biological data between countries, EEA/ETC has transformed the reported national EQR values to normalised EQR values. Calculated by countries Calculated by EEA/ETC H/G G/M M/P P/B Ref: DG Environment
Process for test data exercise:Step-wise approach to test feasibility • Requested data from countries (test data flow), June-Aug. • Quality check and data analysis of the received data, Sept. • Presented results of data analysis to Ecostat, Oct. 2009 for comments • Present results of data analysis to Eionet in Oct. 2009 for comments • If agreement can be achieved on the way forward, establish a WISE-SoE data flow for aquatic biology in 2010 or 2011.
Freshwater test data exercise: What data is requested for rivers and lakes? • Benthic macroinvertebrates in rivers • Phytoplankton in lakes • Macrophytes in lakes
Parameter specifications • Reporting sheets specifying parameters and methods of aggregation are included in the WISE SoE guidance • For full report see: http://eea.eionet.europa.eu/Public/irc/eionet-circle/water/library?l=/wise_reporting_2009&vm=detailed&sb=Title • Requested information for representative stations in selected water bodies • National EQR values for each BQE for 2007 and 2008, if available; • National reference values and EQR class boundaries for each BQE; • Other data for phytoplankton and macrophytes, according to reporting sheets (chlorophyll, % Cyanobacteria, lower growing depth, % Isoetids or Charaphytes) • Supporting background information • Name of the metric used • Station info to allow links to pressure data and map production • Type of water body (national type and most similar IC type) • Some methodological details to aid interpretation • If station information is already reported to EEA, then it is not necessary to report this information again • We need correct National Station ID in order to access this information from EEA
Standardised format for data reporting: Template: xls-file with 3 separate tables • Biology data table • Station and water body info (reported only once and if changed) • Method and class boundaries (reported only once and if changed)
Overview of data reported 32 500 biological values from 8300 stations in 16 countries !!! Sweden Norway Finland UK Estonia Denmark Ireland Lithuania Netherlands Slovakia Belgium Austria France Romania Cyprus Spain
Overview of data reported:Benthic invertebrates in rivers Ca. 5000 water bodies in 16 countries
Overview of data reported:Phytoplankton in lakes Ca. 1000 water bodies in 13 countries
Overview of data reported:Macrophytes in lakes Ca. 500 water bodies in 8 countries
EEA WISE-SoE databases • Station table • National Station ID • Waterbody info • RBD info • etc. • Nutrients table • National Station ID • NO3, Total P, PO4 • etc. • Pressure table • National Station ID • Land-use info • etc. Data compilation New EEA database: biological data from test reporting • Biology table • National Station ID • Metric Biology • Value (EQR) • etc. • Type-specific class boundaries table • Metric biology • Waterbody type • Reference condition • H/G boundary • G/M boundary • etc. • Station table • National Station ID • Waterbody ID • Waterbody type • Longitude, Latitude • etc. Calculation of normalised EQR Show Ecological status for each BQE
Data analyses Station-level map: Status class for each BQE Can also use WB level (WB id missing for 10% of stations) Biological data per BQE compiled and linked to WISE databases Country-level map:Proportion of stations per status class plotted as pie charts for each BQE Country-level bar plot:Plot average normalised EQRfor each BQE for high/good stations and for < good stations Average normalised EQR for each country for all high/good stations and for < good stations Calculate normalised EQR for each BQE and each station
Macroinvertebrates in rivers: Ecological status per station Some stations have unknown status class: • Missing status class, EQR values and/or class boundaries (DK, ES) Some results may not be comparable: • HMWB (NL) • Acidification metrics (SE, UK-SC) • Other non-intercalibrated metrics
Macroinvertebrates in rivers: Ecological status summarised per country • Majority of stations shows high or good status • Is this real or are stations not representative?
Macroinvertebrates in rivers: Normalised EQR per country * Metrics and boundaries in agreement with IC results (ref. JRC-EEWAI)
Phytoplankton in lakes: Ecological status per station Some stations have unknown status class: • Missing EQR values and/or class boundaries (DK) Some results may not be comparable: • HMWB (NL) • Non-intercalibrated metric
Phytoplankton in lakes: Ecological status summarised per country • Majority of stations shows high or good status • Is this real or are stations not representative?
Phytoplankton in lakes: Normalised EQR per country * Metrics and boundaries in agreement with IC results (ref. JRC-EEWAI)
Macrophytes in lakes: Ecological status per station Some stations have unknown status class: • Missing EQR values and/or class boundaries (ES, LT, SE) Some results may not be comparable: • HMWB (NL) • Non-intercalibrated metric
Macrophytes in lakes: Ecological status summarised per country • Majority of stations shows high or good status • Is this real or are stations not representative?
Macrophytes in lakes: Normalised EQR per country * Metrics and boundaries in agreement with IC results (ref. JRC-EEWAI)
Conclusions: Promising results • Comprehensive submission of data: 32500 values from 8300 stations and 16 countries • Data enables assessment of impacts of human pressures (emissions) and water quality as shown by chemical indicators on different ecosystem components, incl. Biodiversity • Clear potential for future trend analysis showing impact of WFD programme of measures • Synergies with the Intercalibration work by revealing problems of translating IC results into national systems • Ecostat support further development of biodata reporting
Conclusions: Caution needed • More time needed to solve the issues related to: • Geographic coverage (missing countries: DE, PL, IT) • Comparability of metrics, boundaries and types of water bodies • Representativity of stations and aggregation methods, links to stations used for chemical indicator reporting and to WFD surveillance monitoring programmes • Coherence with WFD reporting of status in RBMPs? Testing needed • Feedback to countries on data quality: QA needed • Test data should not be published due to these shortcomings • Need for additional biological indicator: Phytobenthos in rivers to show impact of eutrophication of rivers
Way forward in 10 points • Feedback from ETC to countries on quality of test data • Comparison of test data results with WFD RBMPs results for the same WBs • Need to decide on stations or WB reporting and on frequency, annual or less • Updated guidance on representativity of stations or WBs needed • Develop reporting sheet for phytobenthos in rivers • Revise template for data reporting to clarify request for reference values, class boundaries, water types, metrics • Encourage more countries to participate in next data request (DE, PL, IT + several smaller countries) • Continued collaboration with Ecostat/JRC/GIGs to ensure comparability of metrics and correct interpretation of data • Organise a new test data request using revised template in autumn 2010 • Start regular priority data flow in 2011
Thank you for your attention and support !