Download
1 / 68
680 likes | 814 Views
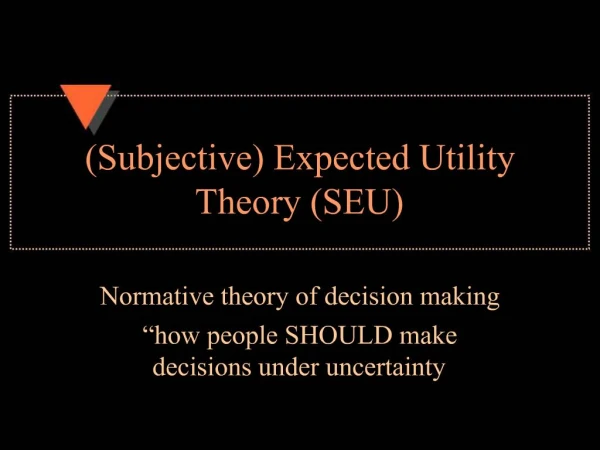
Risky Curves: On the Empirical Failure of Expected Utility. Daniel Friedman, R . Mark Isaac, Duncan James , and Shyam Sunder Cowles Foundation for Research in Economics Yale University February 19, 2014.

E N D
Risky Curves: On the Empirical Failure of Expected Utility Daniel Friedman, R. Mark Isaac, Duncan James , and Shyam Sunder Cowles Foundation for Research in Economics Yale University February 19, 2014
“Utility function is just a device for explaining and predicting responses to choices involving risk.” • Harry Markowitz (Quoted in Rosett, 1967, p. 157) “Thus, finally, the necessity is stressed of discovering the way in which investors conceptualize risk.” • Susan Lepper, concluding her paper in Hester and Tobin, eds. (1967) “It is a veritable Proteus that changes its form every instant.” • Antoine Lavoisier (speaking of phlogiston, quoted in McKenzie [1960], p. 91) Empirical Failure of EU
An Overview • D. Bernoulli (1738) ---Von Neumann Morgenstern (1943): curved utility (Bernoulli) functions to understand choice under risk combined with dispersion of outcomes as risk • This idea (EUT) is widely accepted in the field; theorists devise new parameterized curves (CPT); experimenters devise protocols to elicit data and estimate the parameters • Meager empirical harvest: little stability in parameters outside the fitted context; power to predict out of sample poor-to-nonexistent; no convincing victories over naïve alternatives; surprisingly little insight into phenomena outside the lab (insurance, security, labor, forex markets, gambling, business cycles, etc.) • Very quick reviews (research through 1960; measuring individual risk preferences; aggregate level evidence from the field) • Raise doubts; not sure of way forward, some possibilities • Alternative meanings/measures of risk • Looking for explanatory power in decision makers’ opportunity sets, real options, and net pay-offs, instead of in unobserved curved Bernoulli functions • Current work in evolution, learning theory, neuroeconomics, and physiology Empirical Failure of EU
Historical Review of Research Through 1960 • D. Bernoulli’s “Exposition of a New Theory on the Measurement of Risk” (1738): E log x, not Ex, to explain St. Petersburg paradox (but not gambling) • Jevons (1871) links Bernoulli to decreasing marginal utility, but he and Marshall had difficulty with gambling • Soon the ordinal paradigm took over, in which changes in marginal utility were undefined • Menger (1934): Bernoulli solved only one form of paradox • Cremer’s explanation of small probabilities being ignored • Shapley (1977): “losing and paying arbitrarily large amounts is not credible” as a simpler explanation of the paradox Empirical Failure of EU
Measuring Individual Risk Preferences • Unambiguous definitions and methods of measurement at the heart of sciences • John Von Neumann and Oskar Morgenstern’s challenge: Theory of Games and Economic Behavior (1943 [1953]) axiomatization; more general; and empirical procedure to estimate Bernoulli function from choice data over lotteries and certain prospects • Seven decades of attempts to furnish empirical content to VNM theory include: • Free form thought experiments (Friedman and Savage 1948, Markowitz 1952), both rejected Bernoulli Empirical Failure of EU
Free Form Thought Experiments Friedman and Savage 1948 2 points of inflexion Markowitz 1952 3 points of inflexion Empirical Failure of EU
Empirical Task of Mapping Utilities • Mosteller and Nogee (1951): elicited data from payoff-motivated choice experiments over sample “poker” hands to construct Bernoulli/VNM utility functions (no statistical estimation) • Max EU not unreasonable; Inconsistency in behavior relative to VNM; meager support for F&S; Harvard students “conservative” (i.e., concave), National Guard subjects “extravagant” (i.e., convex) Empirical Failure of EU
Mosteller & Nogee 1951 Empirical Failure of EU
Empirical Task of Mapping Utilities • Ward Edwards (1955): “Another model, which assumes that Ss choose so as to maximize expected utility, failed to predict choices successfully.” (p. 214) Empirical Failure of EU
Edwards (1955): FIG. 1. Experimentally determined individual utility curves. The 45° line in each graph is the curve which would be obtained if the subjective value of money were equal to its objective value. Empirical Failure of EU
Grayson (1960) Empirical Failure of EU
Pratt; Diamond, Rothschild, and Stiglitz (1964-74) • With the work of Pratt; Diamond, Rothschild, and Stiglitz during this decade, EUT with dispersion-based measures of risk (e.g., variance and Arrow-Pratt) were in the driver’s seat • Coexistence of ordinal (absent risk) and neo-cardinal (under risk) utilities (F&S denied derivability of their utility curve from riskless choices, p. 464) • Pure vs. speculative risk distinction of insurance industry and literature was set aside • Explosion of interest in EU with analysis of parameterized utility function • Almost immediately, attempts made to elicit data, and empirically obtain statistical estimates of these parameters using the VNM mapping process, in the hope of explaining and predicting “Economic Behavior” (the second part of the title of the VNM book) beyond non-statistical methods of F&S, Mosteller and Nogee, Markowitz, Edwards, and Grayson • To what extent did these elicitations yield dependable estimates of a person’s propensity to choose under risk?
Examples of Parametric Estimation from Lab and Field Experiments: Absolute (ARA) and Relative (RRA) Risk Aversion • Certainty equivalent (Dillon and Scandizzo 1978) • Lottery choice from menu (Binswanger 1980) • Auctions • Becker-DeGroot-Marschak procedure • Holt-Laury procedure • Pie Chart procedures • Physiological measurements • Payment methods • BDM vs. auctions • Small and large stakes • Problem solving ability • Perception of institutions • Heuristics Empirical Failure of EU
Binswanger’s Field Work in India • Binswanger 1980 used lottery choice and certainty equivalent elicitation methods • Different results from two methods • Only F is inconsistent with risk aversion • Landlord RA > tenants • No high stakes effect • “Luck” was best explanation • Farming investment decisions “cannot be explained by differences in their attitudes…” • Ditto Jacobson and Petrie 2007 Empirical Failure of EU
Auctions • Vickrey 1961 independent value first price sealed bid auction yield overbidding relative to risk neutral prediction • CRRAM (Cox et al. 1988): modification to allow for risk aversion as explanation of overbidding: mixed results • Kagel and Levin 1993: third price sealed bid auction to estimate coefficient of relative risk aversion: risk aversion with n = 5; risk seeking for n = 10 Empirical Failure of EU
Becker-DeGroot-Marschak (1964) Procedure • A special case of second-price auction pitting a lottery-endowed single subject (who submits an ask) against a robotic bidder generating random bids • If bid exceeds the ask, subject sells at the bid price • Otherwise, subject plays the lottery • Harrison 1986, James 2011, Kachelmeier and Shehata 1992: different implementations and institutions yield estimated coefficients that imply risk aversion or risk seeking behavior Empirical Failure of EU
Holt-Laury Procedure • Choose left or right column in each row • Should switch only once (row 5 if risk neutral; above risk seeking) • But 28% multiple switches (in Laury-Holt 2008) • Bosch-Domenech Silvestre 2006: estimate depends on # of rows • Levy-Garbboua et al. 2012 and Taylor 2013: dependence of results on various procedural details Empirical Failure of EU
Pie Chart Procedures • Lotteries shown as pie charts, more transparent and intuitive • Inconsistent results from Becker-DeGroot-Marschak and pie chart procedures Lichtenstein and Slovic 1971; Grether and Plott 1979 • Hey and Orne 1994: Inconsistent choices • Results depend on the number of pie charts presented to subjects; Engle-Warnick et al. 2006 Empirical Failure of EU
Physiological Measurements: Hormones • Harlow and Brown 1990: bidding behavior related to enzyme MAO for men, not women • Sapienza et al. 2009: relationship between Holt-Laury estimates and salivary testosterone levels is highly conditional on gender and background hormone levels • Mixed results from various other studies of risky choice and various hormones (cortisol, estradiol, progestorone), often mutually inconsistent • Effect of pre-natal exposure to testosterone revealed in 2D:4D ratio: inconsistent results • Biometric data tends to vary with time, raising new questions about interpretation of preferences and their stability and usefulness for prediction Empirical Failure of EU
Payment Methods • Frustration with obtaining consistent measurements of risk attitudes from observational data drew attention to details of how subjects are paid • Monetary, consumable, hypothetical? • Paid for all rounds or randomly selected subset of rounds • Single or multiple rounds • Paid each round, or paid sum at the end • Payment in public or private • Whole literature on payments methods influencing the estimates • Generally, everything seems to matter some of the time; no general results Empirical Failure of EU
Becker-DeGroot-Marschak vs. Auctions • Isaac and James 2000: Estimated risk coefficients from different elicitation methods are not only different, they are not even rank-preserving • Subjects identified to be far risk averse by one method of elicitation tend to be far risk seeking from the other method • Difficulty of reconciling the results with extant models N Empirical Failure of EU
Math/Problem Solving Ability • Frederick 2005: could problem solving skills and learning during the task affect the estimates? • Higher CRT scores related to lower risk aversion • Differences in numeracy could be the common cause of the variability of risk coefficients estimated from observed choice data Empirical Failure of EU
Subject Perception of Institution • The choice of the format in which the data and the task are presented to the subjects alter the estimated risk coefficients Empirical Failure of EU
Where Are We Now? • Little evidence that EU (and its variations) predict individual choice better than naïve alternatives • Estimation procedures applied to any choice data necessarily yield a risk coefficient; but exhibit little stability outside contexts • Different ways of eliciting risk parameters in cash-motivated controlled economics experiments yield different results • Perhaps the failure to find stable results isthe result • Variations across elicitation methods are not explained by noise or bias (not mean preserving) • Any robust individual differences: are they caused by Bernoulli functions or problem-solving skills, learning, and adaptation to feedback • Let us look if Bernoulli functions may help us understand aggregate phenomena and furnish some consilience across macro domains Empirical Failure of EU
Are Aggregate Level Phenomena in the Field Explained Better by Bernoulli Functions? • Health, medicine, sports, illicit drugs • Gambling • Engineering • Insurance • Real estate • Bond markets • Stock markets • Uncovered interest rate parity • Equity premium • Aggregate model calibrations • Labor markets • Social/unemployment insurance • Central bank reserves Empirical Failure of EU
Health and medicine, illicit drugs • Dispersion meaning of risk almost absent; risk factors for: • Drug addiction: family history of addiction, being male, having another psychological problem, peer pressure, lack of family involvement, anxiety, depression, loneliness, and taking a highly addictive drug • Heart disease: old, male, family history of heart disease, post-menopausal, non-Caucasian race, smoking, high level of low density lipoprotein, hypertension, obesity, diabetes, high level of C-reactive protein, sedentary lifestyle, and stress • No mention of expectation of a Bernoulli function, or dispersion of outcomes Empirical Failure of EU
Risk Parameters and Risky Personal Behaviors • Barsky 1997 gambling: modest predictive power • Picone et al. 2004 on demand for preventive medical tests: no predictive power • Dohmen et al. 2005: • “Strikingly, the general risk question predicts all behaviors whereas the standard lottery measure does not. The best overall predictor for any specific behavior is typically the corresponding context-specific measure. These findings call into question the current preoccupation with lottery measures of risk preference, and point to variation in risk perceptions as an understudied determinant of risky behavior.” Empirical Failure of EU
Gambling • NRC 1999: $550b wagered in US alone • Attempts to explain by convex Bernoulli functions (F&S 1948) • Markowitz 1952 and Marshall 1984: Optimal bet is implausibly large • Alternatives: entertainment, thrill, bluff, arousal, competition, auto-erotic, • Variable ratio form of Skinnerian conditioning • Design of state lotteries not explainable by Bernoulli functions Empirical Failure of EU
Engineering • NASA: Engineering Reliability Analysis quantifies system risks through a combination of probabilistic analyses, physics-based simulations of key risk factors, and failure timing and propagation models. ERA develops dynamic, integrated risk models to not only quantify the probabilities of individual failures, but also to learn about the specific systems, identify the driving risk factors, and guide designers toward the most effective strategies for reducing risk. • No mention of dispersion measure of risk Empirical Failure of EU
Insurance • Industry size in 2011: $4.6t in premiums; best case for risk aversion • Almost all have negative actuarial value to policy holders; textbook example of widespread aversion to risk; but • Marketing emphasizes loss/harm/injury, not dispersion risk • Other explanations: policy as a put option, cuts costs of contingency planning • Some versions of EUT specify convexity in losses; inconsistent with insurance • Lack of universality of insurance suggests social learning, marketing, and legal requirements may play roles • Einav et al. (2012): correlations among individual risk attitudes obtained from various domains of insurance vary widely (0.06-0.55); but their subjective ordinal measures of risk unrelated to Arrow-Pratt Empirical Failure of EU
Real Estate • Another large part of modern economies • Holland et al. 2000 and Sing and Patel 2001: price variance and new development have negative relationship aversion to risk • Dixit and Pindyck 1994: higher uncertainty also increases the option value from waiting to sink typically irreversible construction costs • Granadier 1996: “This article develops an equilibrium framework for strategic option exercise games. …The model also provides an explanation for why some markets may experience building booms in the face of declining demand and property values. While such behavior is often regarded as irrational overbuilding, the model provides a rational foundation for such exercise patterns.” • Bulan et al. 2009: analysis of 1214 condominium projects in Vancouver Canada during 1979-98 finds that empirical evidence supports the risk-neutral predictions of real options theory. Empirical Failure of EU
Bond Markets • Moody’s and S&P ratings define credit risk as likelihood of default and associated financial loss • No mention of dispersion of outcomes or concave Bernoulli functions • Fisher 1959: Chances of default and marketability of bonds explained 75% variation in yield • Altman 1989: Realized yields net of defaults increase with lower rating for all except B and CCC bonds; not explained by dispersion measure of risk Empirical Failure of EU
Moody’s Ratings(2012, p. 4) • “Ratings assigned on Moody’s global long-term and short-term rating scales are forward-looking opinions of the relative credit risks of financial obligations issued by non-financial corporates, financial institutions, structured finance vehicles, project finance vehicles, and public sector entities. Long-term ratings are assigned to issuers or obligations with an original maturity of one year or more and reflect both on the likelihood of a default on contractually promised payments and the expected financial loss (or impairment) suffered in the event of default. Short-term ratings are assigned to obligations with an original maturity of thirteen months or less and reflect the likelihood of a default on contractually promised payments.” (emphasis added)
Stock markets • Markowitz 1952/1959 presented variance as a measure of risk, tentatively, because of familiarity, convenience, and computability • Sharpe 1964 and Lintner 1965: Linear equilibrium relationship between expected return and covariance risk • Intensive research on empirical evidence on CAPM and diversification • Fama and French 1992: “Our tests do not support the most basic predictions of the SLB model, that average stock returns are positively related to market betas.” • Fama and French 2004: Unfortunately, the empirical record of the model is poor — poor enough to invalidate the way it is used in applications. . . . In the end, we argue that whether the model’s problems reflect weaknesses in the theory or in its empirical implementation, the failure of the CAPM in empirical tests implies that most applications of the model are invalid. Empirical Failure of EU
Stock Markets (2) • Brealey and Myers 2003: “There is no doubt that the evidence on the CAPM is less convincing than scholars once thought. But it will be very hard to reject the CAPM beyond all reasonable doubt. Since data and statistics are unlikely to give final answers, the plausibility of the CPAM will have to be weighed along with the empirical ‘facts’” Empirical Failure of EU
Diversification implication of risk aversion? • Worthington 2009 on household diversification: “Australian household portfolios have very low levels of asset diversification . . . household portfolios appears to bear little relation to the central predictions of classic portfolio theory. • Similar results for other economies (U.S., France, the Netherlands, U.K., Germany, and India). Guiso et al. 2000: “The country studies find that the extent of diversification between and within risk categories is typically quite limited.” • Why aren’t (dispersion) risk averse households partake of almost “free lunch” of diversification? • Holderness 2009 on distribution of corporate ownershi: “Given that 96% of a representative sample of CRSP and Compustat firms have large shareholders and these shareholders on average own 39% of the common stock (Table 1), it is now clear that atomistic ownership is the exception, not the rule, in the United States.” Empirical Failure of EU
Uncovered interest parity • Li et al. 2012: “Uncovered interest parity (UIP) is one of the most important theoretical relations used in analytical work in both international finance and macroeconomics. It is also a key assumption in many of the models of exchange rate determination.” • Exch. Rate Appreciation = a + b*InterestDifferential+ error • Where a =0 and b = 1 and error has mean zero. • Froot and Thaler 1990 meta study: most estimates of b have wrong sign, average = - 0.88! • Li et al. 2012: data from 10 countries, mixed results; estimates vary widely by currency pairs and over time • Concave Bernoulli functions have not helped resolve the puzzle; “…hard to explain the failure of UIP even using a sophisticated measure of risk” (p. 168). Empirical Failure of EU
Equity Premium Puzzle • Difficulties in reconciling empirical estimates of the market risk premium PM= E(RM) – Rf with its theoretical determinants • Mehra and Prescott 1985: assuming plausible levels of CRRA, risk premium should be 0.4%; • But, over 1889-1978 realized risk premium was about 15 times (6%) • Fernandez et al. 2012 survey: 2223 answers from US ranged over 1.5-15%; mean 5.5% • After reviewing dozens of attempts over quarter century to resolve the puzzle, Mehra 2008 states: “The puzzle cannot be dismissed lightly because much of our economic intuition is based on the very class of models that fall short so dramatically when confronted with financial data. It underscores the failure of paradigms central to financial and economic modeling to capture the characteristic that appears to make stocks comparatively riskier.” (emphasis added). • Down in the Wall Street world of traders and financiers, Investopedia dispenses this wisdom: “Equity premium puzzle is a mystery to financial academics.” Empirical Failure of EU
Aggregate model calibrations • Besides equity premium puzzle, calibrated models of aggregate consumption are used in labor and business cycle theory • Kydland and Prescott 1982 and Mehra and Prescott 1985 and use 1 < r < 2, rule out assuming extreme risk aversion • Kydland and Prescott 1991 tighten to r = 2 • Ljungqvist and Sargent 2004: r < 2 or 3 • Resolving the EPP requires r > 10 • Chetty 2006: 33 sets of wage and income elasticities imply r in range 0.15-1.78, mean 0.71. “… Hence, one interpretation of the result is that it provides new evidence against canonical expected utility theory as a descriptive model of choice uncertainty” • Unemployment insurance puzzle: r =2 CRRA consumption model yields 0-20% of wage compared to 50% observed in the field (Baily 1978 and Gruber 1997) • Central banks’ international reserve levels yield r = 2 (CRRA) for Latin America, about 10 for Asia Empirical Failure of EU
Aggregate Level Evidence From the Field • The hope that curved Bernoulli functions, combined with dispersion concept of risk, might yield insights into a variety of socio-economic phenomena in the field waits to be fulfilled • Surprisingly little aggregate level insights or consilience across domains populated by the same agents: credit, insurance, corporate equity, real estate, currency markets, gambling, labor, and business cycles • Academic literature often assumes such functions, but attempts to tie the resulting models to data often lead to wildly different, and mutually inconsistent, implied innate preferences in specified populations. • These empirical inconveniences now carry optimistic labels such as “the interest parity puzzle” suggesting that, one day, solutions may be found without abandoning the paradigm based on Bernoulli functions Empirical Failure of EU
41 Empirical Failure of EU
What is next? • Parameter r for the same population has to vary from 0.15 to 14 (by about two orders of magnitude) to explain observations in various domains of our lives • Possible ways forward: • Alternative meanings/measures of risk • Looking for explanatory power in decision makers’ obseravable opportunity sets, real options, and net pay-offs, instead of in unobserved curved Bernoulli functions • Current work in evolution, learning theory, and neuroeconomics Empirical Failure of EU
If measured Bernoulli functions are so “Protean,” can they help us understand or predict choices? Why have we not found a reliable way after seven decades of intensive effort? • What if there is no reliable measure? Might risk preferences be a figment, like phlogiston, a fluid that chemists once conjured up to explain combustion? • Although it took almost a century, chemists ultimately abandoned the concept, because it failed to explain the data. • A prior question: What is risk? Outside economic theory, risk almost universally refers to the possibility of harm (in engineering, medicine, drugs, safety, gambling, sports, military) • Same is true in insurance, credit, and regulation. Only in certain aspects of economic theory (e.g., equity), does risk refer to variability of outcomes Empirical Failure of EU
Phlogiston • Greeks; Becher(1635–1682); Stahl (1660–1734) • Invisible compressible fluid; able to organize disparate physical phenomena better than alchemists’ earth, air, fire, water • Generated some puzzles of its own: context-dependent mass • Proponents of phlogiston added free parameters, even negative mass to account for the data • Phlogiston theory did not disappear when • It created puzzles instead of explanations, or • Its supporters failed to isolate phlogiston in the laboratory • Phlogiston vanished from respectable science only, when Lavoisier’s powerful oxidation/reduction theory emerged in the late 1780s • Even “Priestley and Cavendish, on whose work much of the new theory was based, clung to the phlogiston theory to the end of their lives.” Empirical Failure of EU
Could Bernoulli Functions be like Phlogiston? • At least since 1940s, risky choice explained by Bernoulli functions • To many, aversion to “dispersion” seems a self-evident truth • But they have not yet delivered the empirical goods (not yet isolated in lab or field; puzzles proliferate) • Controversies on way to measure attitudes to risk • Decades of intensive search by theorists and empiricists in economics, game theory, psychology, sociology, anthropology, and other disciplines: no evidence that attitudes to risk modeled by Bernoulli functions can help predict risky choices out of sample • Nor helped us gain a better understanding of aggregate phenomena in stock, bond, insurance, real estate, labor or forexmarkets, or about medicine, engineering, or gambling • But it will survive until we have something better Empirical Failure of EU
Alternatives? • Not Prospect Theory, just another variant for EU, with free parameters; the value function predicts that people are risk seeking in the loss domain, e.g., would not purchase insurance even at moderately subsidized prices; more free parameters added for probability curve w • This flexibility (supplemented with an unmodeled phase of editing and adjustment) allows prospect theory to rationalize risky-choice data in sample. No evidence on out-of-sample prediction ability in new tasks • Even in-sample, improvement is small (Gloekner and Pachur (2012, Figure 2, 29); after including a standard penalty (such as Akaike or Schwartz–Bayes) for the number of free parameters, often a one-parameter version of expected utility, or even (parameter free) expected value maximization is better: e.g., Hey and Orme (1994), Harless and Camerer (1994), and • No evidence on out-of-sample, out of context predictive power Empirical Failure of EU
47 Empirical Failure of EU
More Proposals • E.g., source-dependent choice model Chew and Sagi (2008), to capture willingness to bet on familiar events than unfamiliar (or ambiguous) events. Fewer free parameters than other context dependent models; Abdellaouiet al. (2011) test on 130 subjects find more ambiguity seeking than aversion • Koszegiand Rabin (2007); reduces the number of free parameters by endogenizingthe reference point z. Abeler et al. (2011) report evidence consistent with the more intuitive predictions; Goette(2012) reports negative results for tougher tests; Heffetzand List (2011) report contrary evidence; Wenner (2013) shows that the Koszegi–Rabin model implies a surprising result, that a consumer who sees a price at the lower end of her anticipated range is less likely to buy a given item than if that same price were at the upper end of her anticipated range. It would be an impressive vindication of the Koszegi–Rabin model if this counterintuitive prediction were true, but Wenner’s experiment finds that the opposite (“good deal”) reaction is far more common. Empirical Failure of EU
Revealed Preferences • Revealed preference theory: bypasses psychological (or biological or metaphysical) questions about the true nature of preferences and points us to the relevant scientific question: At what level can one demonstrate regularity in risky choice? • To find that level, we need to know how people perceive risk, and how perceived risk can be measured. The evidence summarized earlier, suggests that most peopleconsistentlyavoid first-order, stochastically dominated, choices when dominance is transparent and non-negligible. • Evidence on second moments is much more equivocal. Empirical Failure of EU
How Do People Perceive Risk? • Dispersion of quantified outcomes; Markowitz (1952) • The Oxford English Dictionary: “a situation involving exposure to danger” or harm • Banking: operational, political, credit, counterparty, market, or currency risk • Financial economics: June 6, 2012search of SSRN.com database of 345,529 research papers, the word “risk” appears in the titles of 11,144 (3.3%) papers. Of the ten most frequently downloaded of these finance papers, six use the exposure-to-harm meaning of risk, three use the dispersion meaning, and one uses both. Empirical Failure of EU