Download
1 / 28
280 likes | 409 Views
This prospective study assessed the quality of life (QoL) and perimenopausal features in Slovenian women aged 45-54 across three decades (1990, 2000, 2010). Utilizing the EQ-5D questionnaire, the study involved 585 participants in 1990, 655 in 2000, and 334 in 2010. Findings indicate improvements in QoL, with increased age at menopause, enhanced physical activity, and healthier eating habits observed over the years. Yet, a notable decline in sexual desire was reported among nearly 50% of the women. This longitudinal analysis sheds light on the evolving lifestyle and health trends among Slovenian women.

E N D
PERIMENOPAUSAL FEATURES AND QUALITY OF LIFE IN SLOVENIAN WOMEN IN THE YEARS 1990, 2000 AND 2010- A PROSPECTIVE STUDYHelena Meden-Vrtovec, Renata Košir Pogačnik, Nina Slabe, Ivan VerdenikVIII hrvatski kongres o ginekološkoj endokrinologiji, humanoj reprodukciji i menopauzi8. – 11. 9. 2011Brijuni
The main question Has the changing face of modern lifethat includes-new technologies - global crisis - increasingly stressful life - changes in ethical andmoral valuesany impact on QoL in perimenopausal women over the last 2 decades?
Study designProspective, cross-sectional, observationalHealth related quality of life (HRQoL) questionsEQ-SD questionnaire (modified)Survey in 1990, 2000 and 2010
ParticipantsPerimenopausal women aged 45-54 years1990 – 585 women2000 – 655 women2010 – 334 womenLess than 2 million inhabitants in Slovenia
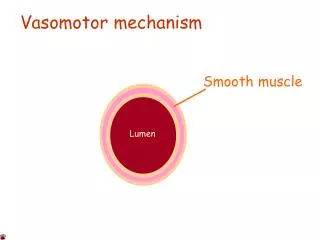
Content of questionnairespersonalsocial historyreproductivelife habitsvasomotorneurovegetative symptomspsychicsexual
General characteristics of womenMean, SD or percentCharacteristic199020002010(n=585)(n=655)(n=334)Age (yrs)49.9±3.049.6±2.850.3±2.7Age at menarche (yrs)14.2±1.013.4±1.613.4±1.7Deliveries (number)1.9±1.01.83±0.81.7±0.7
Sexual activity (percentages)199020002010(n=585)(n=655)(n=334) no sexual intercourse 17.3 8.28.7< once a month (%) 12.8 15.915.9≥ once a month (%) 67.0 70.669.1no answer (%) 2.9 5.46.3
Eating habitsPercent (no. of women)Consumption 1990 2000 2010of dairy products (n=585)(n=655)(n=334)Milk80.9 (473)95.2 (540)93.7 (310)Yoghurt63.6 (372)95.8 (549)97.0 (319)Curd55.7 (326)93.8 (527)93.3 (307)Cheese66.2 (387)97.4 (557)99.1 (329)
Cigarette smokingNon smoking (%) Up to 15 More than 15 per day (%) per day (%)1990 85.09.4 5.62000 79.2 12.3 8.72010 75.716.9 7.4
Physical activityOn daily basis (%) Occasionally (%) Never (%)1990 7.2 10.9 81.9 2000 46.6 22.9 30.6 2010 53.121.6 18.5
Urinary incontinence, joint & muscle diseases, gynecologic diseasesWithout UI (%) Joint&muscle(%) Gynec. disease (%)1990 69.4 25.8 20.9 2000 65.2 30.4 21.9 2010 73.9 18.4 25.5
Low incidence of the following diseases among Slovene perimenopausal womenDiabetesKidneyHeartVessels
Conclusions – general changes observed from 1990 to 2010Age at the menopause increased from 47.7 in 1990 to 51.0 years in 2010Mean values of systolic and diastolic pressuresdecreasedDaily physical activity undertaken by more women: 7% in 1990 vs. 56% in 2010Consumption of healthy food increasedSmoking (especially moderate) increasedSexual desire decreased in about 50% of women
Conclusions – climacteric symptomsMost frequent – nervousnessMost intensive and bothersome – sweatingChest pain – significantly decreased
ConclusionThe QoL in Slovenian perimenopausal women has improved over the last two decades, presumably due to healthier life style.