Download
1 / 31
310 likes | 347 Views
Dive into the comprehensive analysis of line broadening coefficients in the HITRAN Database, including experimental measurements, empirical models, and theoretical calculations. This study presents insights on self- and N2-broadening coefficients with Ka and rotational dependencies, providing valuable data for atmospheric spectroscopy applications. Explore the results obtained at various temperatures to understand the implications of temperature exponents in line broadening. With the incorporation of formaldehydebroadening coefficients, this study bridges experimental findings with theoretical frameworks, enhancing the accuracy of atmospheric spectroscopy. Discover the comparison between measurements, empirical models, and complex formalisms to deepen your understanding of line broadening in atmospheric science.

E N D
Formaldehydebroadening coefficients David Jacquemart, Fridolin Kwabia-Tchana, and Nelly Lacome Laboratoire de Dynamique, Interactions et Réactivité (LADIR), CNRS, Université Pierre et Marie Curie-Paris 6, France HR FT spectra and line broadening measurements Anne Laraia and Bob Gamache Department of Environmental, Earth & Atmospheric Sciences University of Mass. Lowell, USA Calculation of broadening parameters Agnès Perrin Laboratoire Interuniversitaire des Systèmes Atmosphériques (LISA), CNRS, Université Paris XII, Créteil, France Hamiltonian constants 9th HITRAN Database& Atmospheric Spectroscopy Applications conferences
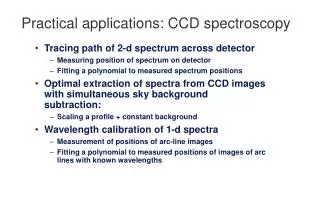
- Two spectral regions of atmospheric interest: around 3.5 µm (2600-3200 cm-1) complete update in HITRAN 2008 around 5.7 µm (1700-1800 cm-1) new line list available in HITRAN 2008 9th HITRAN Database& Atmospheric Spectroscopy Applications conferences
n2 band n1, n5 + 6 other bands Bruker HR120-FTS spectrum recorded at LADIR 9th HITRAN Database& Atmospheric Spectroscopy Applications conferences
Summary of the presentation 1/ Experimental measurements of both self- and N2-broadening coefficients 2/ Empirical model for the rotational dependence of broadening coefficients 3/ Theoretical calculation of N2-broadening coefficients and their temperature exponents 4/ Comparison with literature 9th HITRAN Database& Atmospheric Spectroscopy Applications conferences
Multispectrum fitting procedure → 284 transitions at 5.7 µm region → 456 transitions at 3.5 µm region Self-and N2-broadening coefficients 9th HITRAN Database& Atmospheric Spectroscopy Applications conferences
In HITRAN: Self-widths fixed to 0.00 cm-1/atm Air-widths fixed to 0.107/0.108 cm-1/atm 9th HITRAN Database& Atmospheric Spectroscopy Applications conferences
Ka dependence of the N2-broadening coefficients obtained at 3.5 and 5.7 µm Transitions having same value of Jlow = 8 9th HITRAN Database& Atmospheric Spectroscopy Applications conferences
Summary of the presentation 1/ Experimental measurements of both self- and N2-broadening coefficients 2/ Empirical model for the rotational dependence of broadening coefficients 3/ Theoretical calculation of N2-broadening coefficients and their temperature exponents 4/ Comparison with literature 9th HITRAN Database& Atmospheric Spectroscopy Applications conferences
No evidence of a vibrational dependence (5.7µm 3.6 µm) Evidence of a J- and Ka-rotational dependence of the linewidths
For each set of γ having same J’’ value: J’’ = 8 9th HITRAN Database& Atmospheric Spectroscopy Applications conferences
Empirical parameters describing the J-and Ka-rotational dependence of the N2-broadening coefficients 9th HITRAN Database& Atmospheric Spectroscopy Applications conferences
Empirical parameters describing the J-and Ka-rotational dependence of the self-broadening coefficients 9th HITRAN Database& Atmospheric Spectroscopy Applications conferences
Line broadening (self and by N2) can easily be calculated using these constants JQSRT111 (2010), 1209-1222. 9th HITRAN Database& Atmospheric Spectroscopy Applications conferences
Summary of the presentation 1/ Experimental measurements of both self- and N2-broadening coefficients 2/ Empirical model for the rotational dependence of broadening coefficients 3/ Theoretical calculation of N2-broadening coefficients and their temperature exponents 4/ Comparison with literature 9th HITRAN Database& Atmospheric Spectroscopy Applications conferences
Complex Robert-Bonamy formalism for N2-broadening coefficients Calculation done for the 2 band → Constants for dipole moment of H2CO, for quadrupole of H2CO and N2 taken from literature → Parameters for Lennard-Jones atom-atom potential have been manually fitted to match a reduced set of N2-broadening measurements 9th HITRAN Database& Atmospheric Spectroscopy Applications conferences
Comparison between measurements, empirical model and theoretical calculation (CRB) T = 296 K 9th HITRAN Database& Atmospheric Spectroscopy Applications conferences
Comparison between measurements, empirical model and theoretical calculation (CRB) T = 296 K 9th HITRAN Database& Atmospheric Spectroscopy Applications conferences
CRB calculation of N2-broadening coefficients at 296 K 9th HITRAN Database& Atmospheric Spectroscopy Applications conferences
Temperature exponent based on CRB formalism calculations at various temperatures Set of 7 temperatures: 200, 225, 275, 296, 350, 500, 700 K 9th HITRAN Database& Atmospheric Spectroscopy Applications conferences
Temperature exponent from CRB calculations (200-350 K) In HITRAN 2008: nair fixed to 0.7 9th HITRAN Database& Atmospheric Spectroscopy Applications conferences
Summary of the presentation 1/ Experimental measurements of both self- and N2-broadening coefficients 2/ Empirical model for the rotational dependence of broadening coefficients 3/ Theoretical calculation of N2-broadening coefficients and their temperature exponents 4/ Comparison with literature 9th HITRAN Database& Atmospheric Spectroscopy Applications conferences
Comparison for low Ka values 9th HITRAN Database& Atmospheric Spectroscopy Applications conferences
Conclusion → Measurements of self- and N2-line widths at 296K (for more than 700 transitions) → Empirical model to reproduce the rotational dependence of the measurements → CRB calculation of N2 widths for temperatures ranging from 200 to 700K → Temperature exponents for the N2-widths derived from CRB calculations Generation of self-, air-widths, and nair for HITRAN 2008 line list (available as supplementary materials of JQSRT 111(2010), 1209-1222.) 9th HITRAN Database& Atmospheric Spectroscopy Applications conferences
In the special issue dedicated to Larry 9th HITRAN Database& Atmospheric Spectroscopy Applications conferences
Thanks for your attention… 9th HITRAN Database& Atmospheric Spectroscopy Applications conferences
9th HITRAN Database& Atmospheric Spectroscopy Applications conferences
9th HITRAN Database& Atmospheric Spectroscopy Applications conferences
Sample of the 5.7-µm spectral region 9th HITRAN Database& Atmospheric Spectroscopy Applications conferences
9th HITRAN Database& Atmospheric Spectroscopy Applications conferences
9th HITRAN Database& Atmospheric Spectroscopy Applications conferences
For each set of γ having same Jlow value: Jlow = 8 9th HITRAN Database& Atmospheric Spectroscopy Applications conferences