MODIS Solar Diffuser (SD) Earth Shine Analysis
290 likes | 301 Views
This analysis examines the characteristics of the MODIS Solar Diffuser (SD) and Earth Shine to better understand measurement variations and calibration. It includes an analysis of the SD geometry, stray light, and the effects of Earth shine on SD measurements. The results show the impact of Earth shine is small but more analysis is needed.

MODIS Solar Diffuser (SD) Earth Shine Analysis
E N D
Presentation Transcript
MODIS Solar Diffuser (SD) Earth Shine Analysis MODIS & SeaWiFS Calibration Meeting Feb. 11, 2004 (revised) Robert Wolfe NASA GSFC Code 922, Raytheon ITSS
Xiong, X., J. Sun, J. Esposito, X. Liu, W. L. Barnes, and B. Guenther, “On-Orbit Characterization of a Solar Diffuser’s Bi-Directional Reflectance Factor Using Spacecraft Maneuvers,” Proceedings Earth Observing Systems VIII, W. L. Barnes, ed., SPIE 5151 (2003).
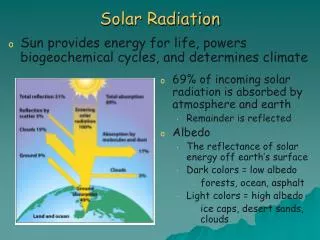
Understanding SD measurement variation – What is the Earth shine contribution?
Simplified SD Geometry Direct Light - full illumination Earth Shine (reflected light) - partial illumination - atmospheric attenuation - clouds and shadows - sun glint - varying albedo - complicated BRDF
MODIS Solar Diffuser Geometry Front of instrument Solar Diffuser Internal Baffle Nominal SD angles (10-17º) 18º Sweet Spotcenter (12.5º) To Scan Mirror Max. Earth glancing angle (27º) SD Port Lowest angle seen by SD (37º) Solar specular Refl. (29º) To Sun
MODIS Solar Diffuser Stray Light Analysis • Analysis program • Fortran with IDL display logic • Uses Two Line Element ephemeris • can easily be run for additional cases • Estimates: • location of stray light from Earth’s surface • sub-satellite point • solar specular reflection point • Separately calculates stray light within normal SD left-to-right view and for full view left-to-right extent • angles estimated from instrument drawings
Key: Red plus – Sub-satellite point Yellow line – Terminator Green line – Lowest angle seen by SD (37.2º) Orange lines – 4º and 8º above lowest SD angle (33.2º and 29.2º) Dark blue line – Earth limb (glancing angle, 27º to 32º) Light blue star – Specular reflection angle (view zenith == solar zenith, relative azimuth == 180º) Light gray line – Stray light from sides Solar Diffuser Stray Light from Earth Surface (1 of 3) 2000/059.0435.91 (14.205º) – Start of “sweet spot”
Key: Red plus – Sub-satellite point Yellow line – Terminator Green line – Lowest angle seen by SD (37.2º) Orange lines – 4º and 8º above lowest SD angle (33.2º and 29.2º) Dark blue line – Earth limb (glancing angle, 27º to 32º) Light blue star – Specular reflection angle (view zenith == solar zenith, relative azimuth == 180º) Light gray line – Stray light from sides Solar Diffuser Stray Light from Earth Surface (2 of 3) 2000/059.0436.92 (10.824º) – End of “sweet spot”
Key: Red plus – Sub-satellite point Yellow line – Terminator Green line – Lowest angle seen by SD (37.2º) Orange lines – 4º and 8º above lowest SD angle (33.2º and 29.2º) Dark blue line – Earth limb (glancing angle, 27º to 32º) Light blue star – Specular reflection angle (view zenith == solar zenith, relative azimuth == 180º) Light gray line – Stray light from sides Solar Diffuser Stray Light from Earth Surface (3 of 3) 2000/059.0435.91 and 0436.92 (14.205º and 10.824º) 10.824º 14.205º
L1B Data from 2000/059.0440 start end Specular reflection
MODIS/Terra Stray Light Analysis • Purpose: study effects of stray light (earth-shine) on MODIS Solar Diffuser (SD) results • Analysis notes: • only non-saturated non-thermal bands shown • data is from 15 orbits starting with 2003/183.2010 – first data after SD door anomaly • background/bias (from space view) subtracted • all values are band averages for all SD samples in a scan • both mirror sides used – smoothing performed (3 scans, triangular weighting) • corrected for SD/sun cosine angle and SD BRF • additional smoothing performed in scan direction (21 scans, triangular weighting) • no temperature correction
MODIS/Terra SD Values for Selected Bands 2003/183.2010 (o1: first orbit) to 2003/184.1915 (o15: last orbit) Sweet spot (14.2 to 10.8 degrees)
MODIS/Terra Sweet Spot Values and Ratios for Ocean Bands2003/183.2010 (first orbit: 1) to 2003/184.1915 (last orbit: 15) R. Wolfe, Dec. 10, 2003
Sweet Spot Summary • Earth shine features are visible • see bands 12 & 19 • Effect in sweet spot is small (during this one-day period) • at SD radiances +/- 0.2 % • largest effect is for band 8 • More analysis of stray light on SDSM needed
Image STS092-316-24 Date: 16:28:12Z 10/24/2000 Nadir Point: 48.0N, 39.2E At nadir point: Sun Azimuth: 277º Spacecraft Altitude: 374 km Sun Elevation Angle: -22º Orbit Number: 200 Limb images courtesy of Earth Sciences and Image Analysis Laboratory, NASA Johnson Space Center (http://eol.jsc.nasa.gov)
MODIS vs. Shuttle/Space Station Geometry MODIS Shuttle Sun (not to scale)
Frame 24 Time: 14:01:23Z Nadir Sun El: -08 Pacific Ocean 09/12/1995 STS069-725 398 km Alt.
Frame 17712 Time: 06:34:35Z Nadir Sun El: -27 Frame 17713 Time: 06:34:55Z Nadir Sun El: -26 Frame 17714 Time: 06:35:27Z Nadir Sun El: -26 Frame 17715 Time: 06:37:01Z Nadir Sun El: -25 Frame 17716 Time: 06:37:17Z Nadir Sun El: -24 Frame 17717 Time: 06:40:15Z Nadir Sun El: -21 Frame 17718 Time: 06:40:30Z Nadir Sun El: -20 Frame 17719 Time: 06:40:39Z Nadir Sun El: -20 Atmospheric Limb 10/20/2003 ISS007E 383 km Alt.
Frame 10812 Time: 10:19:59Z Nadir Sun El: -09 Frame 10811 Time: 10:19:25Z Nadir Sun El: -08 Frame 10810 Time: 10:17:46Z Nadir Sun El: -06 Frame 10809 Time: 10:17:43Z Nadir Sun El: -06 Frame 10808 Time: 10:17:23Z Nadir Sun El: -06 Frame 10807 Time: 10:17:20Z Nadir Sun El: -06 Frame 10806 Time: 10:17:17Z Nadir Sun El: -05 Frame 10805 Time: 10:17:01Z Nadir Sun El: -05 Pacific Ocean 07/21/2003 ISS007E 377 km Alt.
SD Spectral Response Asymmetry • SD analysis for areas during partial illumination can be used to estimate degree of SD Earth-shine contamination • Some detectors primarily see the top half of the SD (detectors 6-10) and others the bottom half (detectors 1-5) • During ramp up from partial (50% or more) to full illumination, spectral differences in the ratio of the top half vs. bottom half (T/B) are partially due to Earth-shine contamination of the SD top half • Other effects may include (expected to be small): • SD BRF • Non-linear gain • Residual bias • Before analysis the following effects must be removed: • Sample times of different bands (because of focal plane location) • Individual detector gain differences • Band-to-band registration
SD illumination 50% illumination Earth shine and direct illumination Not illuminated Full illumination Earth shine and direct illumination Direct illumination (notional)
“Sweet Spot” (14.2º to 10.2ºinst. elevation) ~50% illumination (24º inst. elevation) SD Response during from partial (~50%) to full illumination SD response from partial to full illumination
Spectral Contamination • Absolute contamination is not as important as the relative variation in the sweet spot. This latter effect is only +/- 0.2% (B8 over a single day) Lsd = Lsun + Learth Lsd(t) = Lsd + δLsd(t) = Lsun + Learth + δLearth(t) Learth = -1.5% Lsun (for B8) δLearth(t) = +/- 0.2% Lsun (for B8 – one day)
Simulation of Sun-glint at High Solar Zenith Simulated (6S) Measured
Next Steps • Better understand spectral dependence by simulation of various surface components (snow, vegetation, water) and atmospheric components (aerosols, clouds, water vapor) • Better understand individual detector’s view of SD • Better understand Earth-shine contribution to SDSM measurements • what is the Earth-shine contribution (if any)? • what is the SDSM response to non-uniform SD – which part of the SD does the SDSM see? • Better understand the variability of the SD measurements since SD door fixed open • Understand impact on NPP/VIIRS – very similar solar diffuser geometry
SD Spectral Response Asymmetry – Preliminary Analysis • Caveats – data not corrected for: • Individual detector gains • Band-to-band offsets • Sampling time • These results do not agree with individual detector m1’s (computed in the sweet spot)
Top vs. Bot (T/B) ratio (3 detectors) SD Response during from partial (~50%) to full illumination “Sweet Spot” (14.2º to 10.2ºinst. elevation) ~50% illumination (24º inst. elevation) T/B ratio w.r.t. Band 19 (5 detectors) T/B ratio w.r.t. Band 19 (3 detectors)
T/B ratio w.r.t. all bands (3 detectors) – day 183 T/B ratio w.r.t. all bands (3 detectors) – day 184 T/B ratio w.r.t. all bands (5 detectors) – day 183 T/B ratio w.r.t. all bands (5 detectors) – day 184