Download
1 / 25
250 likes | 266 Views
Learn about the principles and techniques of graphical presentation of information, including resolution, consistency, and the power of charts. Explore various charting principles and examples from different industries. Discover how to effectively present data using visual elements and enhance the viewer's understanding. References to Edward Tufte's works on data visualization provided.

E N D
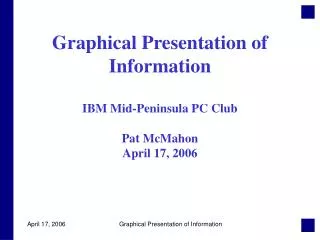
Graphical Presentation of InformationIBM Mid-Peninsula PC ClubPat McMahonApril 17, 2006 Graphical Presentation of Information
References • The Guru - Edward Tufte • (1983). The Visual Display of Quantitative Information. Cheshire: Graphics Press. • (1990). Envisioning Information. Cheshire: Graphics Press. • (1997). Visual Explanations: Images and Quantities, Evidence and Narrative. Cheshire: Graphics Press. • Microsoft Corp. (1997). Excel97 Worksheet Function Reference. Redmond: Microsoft Press. • Hawley, David and Raina (2004). Excel Hacks. Sebastopol: O’Reilly Media. Graphical Presentation of Information
Tufte Basic Principles • Resolution • Photographic film can hold the most information per unit of area • Video displays hold the least • PowerPoint slides can encourage “PP Phluff” (and so can video displays and web pages) • Therefore, don’t waste real estate on “non-value-add” content • Less ink • Use gridlines, borders, boxes, etc. sparingly • Small replicates • For “dashboards,” “balanced scorecards,” etc., strive for consistency of format from chart to chart Graphical Presentation of Information
Other Charting Principles • Baldrige • Level, Trend, Benchmark • Miscellaneous • Normalizing • “What if?” charts • Randomizing data Graphical Presentation of Information
The Power of Charts Graphical Presentation of Information
Computer Industry Revenues(first try) Graphical Presentation of Information
Computer Industry Revenues(final version) Graphical Presentation of Information
Are Salaries Administered Equitably? Compa-Ratio Comparison 1.40 979 U.S. Employees 1.20 1.12 1.08 1.08 1.06 1.05 1.04 1.05 1.04 1.03 1.01 1.01 1.00 1.00 Compa-Ratio .80 .60 1 2 3 1 2 3 1 2 3 1 2 3 Salary Table 1 Salary Table 2 Salary Table 3 Salary Table 4 309 People 562 People 76 People 32 People Performance Rating Within Geographic Region Graphical Presentation of Information
Why is this Process Ineffective? Graphical Presentation of Information
Which is the Best Selling Unit? Graphical Presentation of Information
Are You Sure? Graphical Presentation of Information
What Happened to the 80/20 Rule? Field Repair Cost by Cause $800,000 1800 1600 $700,000 1400 $600,000 1200 $500,000 Cost 1000 $400,000 800 $300,000 600 $200,000 400 $100,000 200 $0 0 A B C D E F G H Cause Graphical Presentation of Information
Deming’s Funnel Experiment Graphical Presentation of Information
Deming’s Red Bead Experiment Graphical Presentation of Information
Make Your Own Control Charts Graphical Presentation of Information
Make Your Own Run Charts Graphical Presentation of Information
Make Your Own Run Charts Graphical Presentation of Information
2 1/2 Factors in 2 Dimensions Graphical Presentation of Information
3 Factors in 2 Dimensions Graphical Presentation of Information
Use of the NOW Function Graphical Presentation of Information
NOW and What if? Graphical Presentation of Information
What’s the Best 401k Choice? Graphical Presentation of Information
What If We Used Consultants? Increased Performance Objective Current Situation Graphical Presentation of Information
Show Me the Important Stuff Graphical Presentation of Information
What Would Tufte Say? Graphical Presentation of Information