Download
1 / 21
210 likes | 223 Views
This article discusses the importance of measuring the spatial and temporal distribution of the electric field in thunderclouds. LIDAR systems provide high-resolution measurements of electric field strength and direction in real-time.

E N D
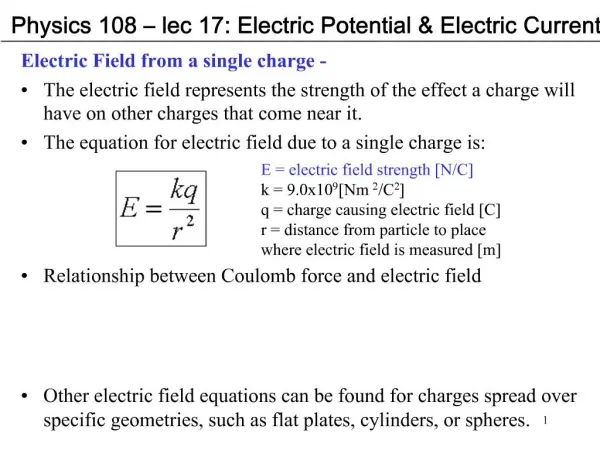
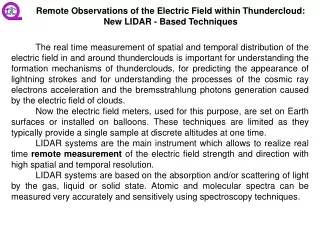
The real time measurement of spatial and temporal distribution of the electric field in and around thunderclouds is important for understanding the formation mechanisms of thunderclouds, for predicting the appearance of lightning strokes and for understanding the processes of the cosmic ray electrons acceleration and the bremsstrahlung photons generation caused by the electric field of clouds. Now the electric field meters, used for this purpose, are set on Earth surfaces or installed on balloons. These techniques are limited as they typically provide a single sample at discrete altitudes at one time. LIDAR systems are the main instrument which allows to realize real time remote measurement of the electric field strength and direction with high spatial and temporal resolution. LIDAR systems are based on the absorption and/or scattering of light by the gas, liquid or solid state. Atomic and molecular spectra can be measured very accurately and sensitively using spectroscopy techniques. Remote Observations of the Electric Field within Thundercloud:New LIDAR - Based Techniques
Geometric Mie Reyleigh Back Raman Fluorescence Elastic Non Elastic Scattering of Electromagnetic Waves EM wave induced dipole moment P ~ χ (1)E + χ (2)E1E2 + χ (3)E1E2E3 + … Linear Nonlinear
P ~ χ (3)E1E2E3exp{ i [ΔKr – Δωt ]} ω= ω1 – ω2 + ω3 K =K1 – K2 + K3 I ~ │χ(3)│2I1I2I3 Four Wave Mixing
1. Difference Frequency Generation P ~ χ (3)E1E2E ωE= ω3 = 0 =>ω= ω1 – ω2 K =K1 – K2 I ~ │χ(3)│2I1I2E2 Experimentally realized (laboratory)!!! Four Wave Mixing & Electric Field V. N. Ochkin et all. 1995 1atm, 532nm,683nm H2 – 2.4 μm => 20V/cm 2. Sum Frequency Generation P ~ χ (3)E1E3E ωE=ω2= 0=>ω= ω1 + ω3 K =K1 + K3 I ~ │χ(3)│2I1I3E2 Experimentally realized (laboratory)!!!
Electric Field Induced Second harmonic generation (EFISH) • P ~ χ (3)(2ω) E12E • ωE= ω2= 0 • ω1 = ω3 • I2ω ~ │χ(3)(2ω)│2I12E2 • Third harmonic generation • P ~ χ (3)(3ω) E13 • I3ω ~ │χ(3)(3ω)│2I13 • Electric Field • E2 ~ │χ(3)(2ω)/χ(3)(3ω)│2 I1I2ω̸ I3ω • Proposed!!! Second and Third Harmonic Generation & Electric Field N2 – ω1 = 4.2 μm O2 – ω1 = 6.3 μm CO2 – ω1 = 7.5 μm H2O – ω1 = 2.7 μm
Infrared Wave Generation • ω3 = ωE = 0 • ω1 – ω2 = Ω = ωir • Iir ~ │χir(3)│2I1I2E2 • Coherent Antistokes Raman Scattering (CARS) • ω3 = ω1 • 2ω1 – ω2 = ωas • Ias ~ │χCARS(3)│2I12I2 • Electric Field • E2 ~ │χCARS (3)/ χir (3) │2I1Iir / Ias • Experimentally realized (laboratory)!!! CARS & Electric Field P. Bohm et all. 2013 1000 mbar H2 – 2.4 μm => 20V/cm N2 – 4.29μm => 300V/cm
Nonlinear spectroscopy • Advantages: • Direct measurement of the electric field. • High spectral resolution (Limited by laser line-widths). • Disadvantages: • Required two laser sources. • Registration of IR signal (required fast IR detector for spatial and temporal resolution). • Strong absorption of the IR radiation by water (required additional investigations). • Development for other molecules, atoms, charged molecules, ions, isotopes etc. • Development of Nonlinear spectroscopy techniques for remote sensing in situ. • Linear Spectroscopy • Advantages: • One laser source • Disadvantages: • Electric field measurement via its influence on the spectrum of gases (not direct). • Required high resolution spectrometer, including IR. • Required large aperture receiving optics. • Required (in some cases) high power IR laser. • The electric field remote sensing methodology in thunderclouds need additional investigations and development !!! Comparison of Linear and Nonlinear techniques
Laser Emitter (a+b) Receiving Telescope (c), Polarization Separator (d). Development of Atmospheric Polarization LIDAR System
Laser Emitter Laser Emitter output beam parameters Pulse Energy 1064nm 300-500 mJ 532nm 100-200 mJ Beam Divergence <10-4 rad Polarization linearity <10-3 Pulse duration 10 ns Repetition rate 10-20 Hz Output beam diameter 112 mm 1 - Convex mirror, 2 – Electro optical Q-Switch, 3 – Diaphragm, 4 – Output polarizer, 5 – laser oscillator pump chamber, 6 – Quarter wave-plate, 7 – Concave mirror, 8 and 16 – Two wavelength mirrors, 9 – Glan prism polarizer, 10 – Flash- lamp driver cables, 11 – mirror, 12 – Cooling system pipes, 13 – Laser amplifier pump chamber, 14 – Flash-lamps, 15 – Second harmonic generator, 17 – Hole for the output beam.
Polarization Separator The green points are the separated cross-polarized beams.
Laser Emitter and Receiving Optical System Alignment Alignment Laboratory Stand • By means of the laboratory stand was aligned: • The Laser, including, laser oscillator and laser amplifier. • The Laser with Beam Expander (14X). • Diode Laser beam with its beam expander (200X). • Diode Laser beam optical axis with RT housing tube axis. • Receiving Telescope (RT) mirror optical axis with Diode Laser beam optical axis and RT housing axis. • Polarization Separator (PS) optical axis with RT Mirror optical axis. • PS with cross-polarized beams outputs and RT mirror focus. • Signal transportation fibers with cross-polarized beams. • Adjustment of PMTs for registration of GLD beam.
System Triggering Photodiode PMTs Laser Beam Expander The YerPhI LIDAR System The Laser Aiming Optics Q-Switch Driver Cables Laser Cooling Pipes Laser Emitter Alignment Receiving Telescope Flash-lamp Supply Cables Signal and Supply Cables
Laser Beam Expander Registration System Triggering Fiber Aiming Optics Laser Emitter Output Energy Control Fibers The Laser Registration System Triggering Photodiode LIDAR System Laser Emitter Alignment Mount Receiving Telescope Laser Emitter Alignment Polarization Separator Alignment Mount PMTs Optical Filter Boxes Polarization Separator Receiving Mirror Focus Finder Optical Signal Outputs Stepper Motor end Switch Optical Signal Transportation Fibers to PMTs Play-free Gear Stepper Motor
LIDAR Controllable Parameters • LE beam 1064nm output energy. • LE beam 532nm output energy. • LE beam repetition rate. • LE Q-Switch driver pulse delay. • LE beam polarization finder. • PS – LE beam polarization angle. • Registration delay. • LE – RT angle. • PMT supply voltage. • LIDAR azimuth and elevation. • LE cooling temperature. System Triggering PD and its electronics The LIDAR Registration and Control System PMT Power Supplies Triggering Pulse (5nsec/div). NI USB DAQ NI DAQ BNC Inputs and Outputs PD and PMT Amplifier Power Supplies Stepper Motor Driver PMT with voltage divider and Signal Amplifier Oscilloscope 500MHz
The YerPhI LIDAR System Sorry for quality.
First Backscattered Signal Observations Laser flash-lamp background and Reflected from a wall signal (250m). Horizontal - 30m/div; Vertical signals - 0.1V/div; Vertical trigger - 2V/div; PMT - 0.5kV. Backscattering from the Atmosphere. Horizontal - 750m/div; Vertical - 20mV/div; Laser - 100mJ; PMT - 2kV; PS ~ 90deg.
First Backscattered Signal Observations Scattering from Atmosphere and Clouds. (Hor.-750m/div; Ver.-20mV/div; PMT-2kV; PS-90deg).
First Backscattered Signal Observations Scattering from Atmosphere and Clouds. Horizontal - 750m/div; Vertical - 50mV/div; PMT - 2kV; PS ~ 45deg).
1. Reyleigh and Mie backscattering: – Depolarization ratio profile. 2. Raman backscattering N2 (607nm), O2(580nm), H2O (645nm): – Depolarization ratio of spectral bands. 3. Electric field under and inside the clouds. Planned Investigations in Nearest Future
P ~ χ (1)E1 exp{ i [ K1r – ω1t ]} 1. Power - Absorption, etc. 2. Wavelength - Raman, Fluorescence, Stark, Doppler, etc. 3. Line-width - Stark, Doppler, etc. 4. Polarization - Kerr, Pockels, Faraday, etc. Linear Polarization φ = 2π (no - ne) L / λ = 2π B L E12 Bwater = 5.2 10-12 cm/V2 For 1000 V/cm and 500m =>φ = π /2 --> λ/4 plate