1. Abstract
CATG. CATG. CATG. CATG. CATG. CATG. CATG. SAGE

1. Abstract
E N D
Presentation Transcript
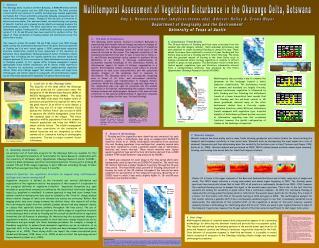
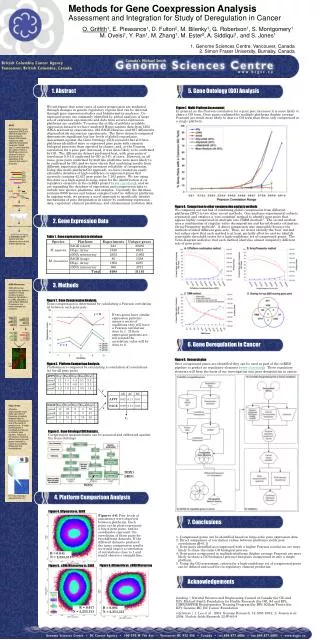
CATG CATG CATG CATG CATG CATG CATG SAGE Serial analysis of gene expression (SAGE) is a method of large-scale gene expression analysis.that involves sequencing small segments of expressed transcripts ("SAGE tags") in such a way that the number of times a SAGE tag sequence is observed is directly proportional to the abundance of the transcript from which it is derived. A description of the protocol and other references can be found at www.sagenet.org. AAA AAA AAA AAA AAA AAA AAA AAA AAA AAA AAA AAA AAA …CATGGATCGTATTAATATTCTTAACATG… cDNA Microarrays cDNA Microarrays simultaneously measure expression of large numbers of genes based on hybridization to cDNAs attached to a solid surface. Measures of expression are relative between two conditions. For more information, www.microarrays.org. GATCGTATTA 1843 Eig71Ed TTAAGAATAT 33 CG7224 AAA AAA AAA AAA AAA AAA AAA AAA AAA AAA AAA AAA AAA AAA AAA AAA AAA AAA AAA AAA Oligo. Arrays Affymetrix oligonucleotide arrays make use of tens of thousands of carefully designed oligos to measure the expression level of thousands of genes at once. A single labeled sample is hybridized at a time and an intensity value reported. Values are the based on numerous different probes for each gene or transcript to control for non-specific binding and chip inconsistencies. For more information, www.affymetrix.com. Methods for Gene Coexpression Analysis Assessment and Integration for Study of Deregulation in Cancer O. Griffith1, E. Pleasance1, D. Fulton2, M. Bilenky1, G. Robertson1, S. Montgomery1 M. Oveisi1, Y. Pan1, M. Zhang1, M. Ester2, A. Siddiqui1, and S. Jones1 1. Genome Sciences Centre, Vancouver, Canada 2. Simon Fraser University, Burnaby, Canada 5. Gene Ontology (GO) Analysis 1. Abstract We anticipate that some cases of cancer progression are mediated through changes in genetic regulatory regions that can be detected through gene expression studies and bioinformatics analyses. Co-expressed genes are commonly identified by global analyses of large sets of expression experiments and data from several expression platforms are available. To assess the utility of publicly available expression datasets we have analyzed Homo sapiens data from 1202 cDNA microarray experiments, 242 SAGE libraries and 667 Affymetrix oligonucleotide microarray experiments. The three datasets compared demonstrate significant but low levels of global concordance. Assessment against the Gene Ontology (GO) revealed that all three platforms identified more co-expressed gene pairs with common biological processes than expected by chance, and, as the Pearson correlation for a gene pair increased, it was more likely to be confirmed by GO. The Affymetrix dataset performed best, with gene pairs of correlation 0.9-1.0 confirmed by GO in 74% of cases. However, in all cases, gene pairs confirmed by multiple platforms were more likely to be confirmed by GO, and we have shown that combining results from different expression platforms increases reliability of coexpression. Using this multi-platform/GO approach, we have created an easily extensible database of high-confidence co-expressed genes that currently contains 43,437 gene pairs for 7,103 genes. We are using this data as a high signal-to-noise input for the identification of cis regulatory elements in the cisRED project (www.cisred.org), and we are expanding the database of expression and coexpression data to include new species, platforms, and samples. Currently the database contains 6988 mouse and human samples from five different platforms. In ongoing work, we propose a novel approach to specifically identify mechanisms of gene deregulation in cancer by combining expression data, regulatory element predictions, and chromosomal mutation data. Figure 7. Multi-Platform Assessment In general, as the Pearson correlation for a gene pair increases it is more likely to share a GO term. Gene pairs confirmed by multiple platforms (higher average Pearson) are much more likely to share a GO term than those only coexpressed in a single platform. Figure 8. Comparison to other coexpression analysis methods We compared our method of combining global coexpression from different platforms (2PC) to two other recent methods. One analyzes experimental subsets separately and employs a ‘vote-counting’ method to identify gene pairs that appear highly coexpressed in multiple sets (TMM method)1. The second method uses a combination of singular value decomposition and kernel density estimation (ArrayProspector method)2. A direct comparison was impossible because the methods utilized different gene sets. Thus, we do not identify the ‘best’ method but rather show that each method is at least partially effective and we identify reasonable threshold scores for a high-confidence set of coexpressed genes. The Venn diagram indicates that each method identifies almost completely different sets of gene pairs. 2. Gene Expression Data Table 1. Gene expression data in database 3. Methods Figure 1. Gene Coexpression Analysis. Gene coexpression is determined by calculating a Pearson correlation (r) between each gene pair. r ≈ 0 If two genes have similar expression patterns across a series of conditions they will have a Pearson correlation close to 1. If their expression patterns are not related the correlation value will be close to 0. 6. Gene Deregulation in Cancer r ≈ 1 Figure 9. Research plan Once coexpressed genes are identified they can be used as part of the cisRED pipeline to predict cis regulatory elements (www.cisred.org). These regulatory elements will form the basis of our investigation into gene deregulation in cancer. Figure 2. Platform Comparison Analysis. Platforms are compared by calculating a correlation of correlations (rc) for all gene pairs. r r rc Figure 3. Gene Ontology (GO) Analysis. Coexpression measurements can be assessed and calibrated against the Gene Ontology. DDX1 SRD1 WRN 4. Platform Comparison Analysis Figure 4. Affymetrix vs. SAGE Figures 4-6: Poor levels of consistency were observed between platforms. Each point on the plots represents a bin of gene pairs, and its coordinates represent the correlation of those pairs for two different datasets. If the different datasets produced the same coexpression results we would expect a correlation of correlations close to 1 and would observe a straight line. 7. Conclusions 1. Coexpressed genes can be identified based on large-scale gene expression data. 2. Direct comparison of correlation values between platforms yields poor correlations (R<0.1) 3. Gene pairs identified as coexpressed with a higher Pearson correlation are more likely to share the same GO biological process. 4. Gene pairs coexpressed in multiple platforms (higher average Pearson) are more likely to share a GO biological process than pairs coexpressed in only a single platform. 5. Using the GO assessment, criteria for a high-confidence set of coexpressed genes can be defined and used for cis-regulatory element prediction. R = 0.041 N = 2,253,313 Figure 6. Affymetrix vs. cDNA Microarray Figure 5. cDNA Microarray vs. SAGE Acknowledgements funding | Natural Sciences and Engineering Council of Canada (for OG and EP); Michael Smith Foundation for Health Research (for OG, SJ and EP); CIHR/MSFHR Bioinformatics Training Program (for DF); Killam Trusts (for EP); Genome BC; BC Cancer Foundation references | 1. Lee et al. 2004. Genome Research. 14:1085-1094; 2. Jensen et al. 2004. Nucleic Acids Research 32:W445-8 R = 0.017 N = 2,253,313 R = 0.095 N = 2,253,313