INTEGRATION Framework: Evaluating Environmental Impacts of Intelligent Transportation Systems
The INTEGRATION model framework is introduced for assessing the environmental impacts of Intelligent Transportation Systems (ITS), addressing the limitations of traditional average-speed models. By integrating car-following dynamics, energy consumption, and emission models, the framework allows for precise estimations based on instantaneous vehicle speed and acceleration. Sample scenarios demonstrate its effectiveness in capturing real-world conditions and showcase how adjustments in driver behavior can yield significant environmental benefits, comparable to adaptive traffic control systems.

INTEGRATION Framework: Evaluating Environmental Impacts of Intelligent Transportation Systems
E N D
Presentation Transcript
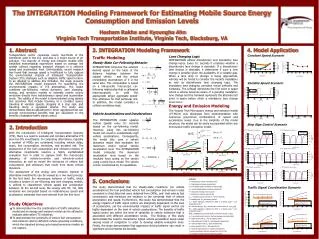
1. Abstract Transportation sector consumes nearly two-thirds of the petroleum used in the U.S. and also is a major source of air pollution. The majority of energy and emission models offer simplified mathematical expressions based on average link speeds without regarding transient changes in a vehicle’s speed and acceleration level. Unfortunately, recent research has found that average speed is insufficient to fully capture the environmental impacts of Intelligent Transportation System (ITS) strategies such as adaptive traffic signal control. In an attempt to address this limitation, the study presents the INTEGRATION model framework for quantifying the environmental impacts of ITS alternatives. The model combines car-following, vehicle dynamics, lane changing, energy, and emission models to estimate mobile source emissions directly from instantaneous speed and acceleration levels. The validity of the model is demonstrated using sample test scenarios that include traveling at a constant speed, traveling at variable speeds, stopping at a stop sign, and traveling along a signalized arterial. The study also demonstrates that an adjustment in driver aggressiveness can provide environmental benefits that are equivalent to the benefits of adaptive traffic signal control. 4. Model Application Constant Speed Scenario Variable Speed Scenario Stop Sign Control Scenario Traffic Signal Coordination Scenario The INTEGRATION Modeling Framework for Estimating Mobile Source Energy Consumption and Emission LevelsHesham Rakha and Kyoungho AhnVirginia Tech Transportation Institute, Virginia Tech, Blacksburg, VA 3. INTEGRATION Modeling Framework Lane Changing Logic INTEGRATION utilizes discretionary and mandatory lane change logics. Every 0.1 seconds it considers whether a discretionary lane change is desirable. If a discretionary lane change is desirable, it determines if such a lane change is possible given the availability of a suitable gap. When a lane drop or diverge is being approached, vehicles will be forced to consider the model’s mandatory as well as discretionary lane changing logic. The mandatory lane changing considers virtual softwalls and hardwalls. The softwall represents the first point in space where a vehicle becomes aware of a pending mandatory lane change and the hardwall represents the absolute last point in space before which a mandatory lane change must occur. Energy and Emission Modeling The Virginia Tech Microscopic energy and emission model (VT-Micro) was developed from experimentation with numerous polynomial combinations of speed and acceleration levels. Due to the simplicity of the model structure, the model can be easily incorporated within any microscopic traffic simulation model. Traffic Modeling Steady-State Car-Following Behavior Vehicle Accelerations and Decelerations INTEGRATION computes the vehicle’s desired speed on the basis of the distance headway between the subject vehicle and the vehicle immediately downstream of it in the same lane. This computation is based on a link-specific microscopic car-following relationship that is calibrated macroscopically to yield the appropriate target aggregate speed-flow attributes for that particular link. In addition, the model considers a collision avoidance logic. The INTEGRATION model updates vehicle speeds every 0.1 seconds based on the car-following model. However, using this car-following model can result in unrealistically high vehicle accelerations. Consequently, the model also uses a vehicle dynamics model that estimates the maximum and/or typical vehicle acceleration level. The INTEGRATION model computes the maximum acceleration level based on the resultant force acting on the vehicle using a point force model. The vehicle is then constrained by its capabilities. 2. Introduction With the introduction of Intelligent Transportation Systems (ITS), there is a need to evaluate and compare alternative ITS and non-ITS investments. In comparing alternatives, typically a number of MOEs are considered including vehicle delay, stops, fuel consumption, emissions, and accident risk. The assessment of the fuel consumption and emission impacts of alternative investments requires a highly sophisticated evaluation tool in order to capture both the microscopic dynamics of vehicle-to-vehicle and vehicle-to-control interaction, as well as model the intricacies of vehicle fuel consumption and emissions that result from these vehicle dynamics. The assessment of the energy and emission impacts of alternative investments can be viewed as a two-level process. At the first level, the microscopic behavior of traffic, which includes a system of car following and lane changing models, is utilized to characterize vehicle speed and acceleration behavior. At the second level, the energy and HC, CO, NOx emissions are computed based on instantaneous speed and acceleration estimates that were derived from the first level. Study Objectives 5. Conclusions NOTATION a = Instantaneous vehicle acceleration (m/s2) c1 = fixed distance headway constant (km) c2= first variable distance headway constant (km2/h) c3 = second variable distance headway constant (h) F = residual force acting on the truck (N) F = tractive force acting on the truck (N) Fmax = maximum tractive force (N); Ft = tractive force (N) h = headway (km); kj = jam density (veh/km) Lei,j = Model regression coefficient for MOE “e” at speed power “i” and acceleration power “j” M = vehicle mass (kg) ; Mta = vehicle mass on tractive axle, M percta (kg) Mei,j = Model regression coefficient for MOE “e” at speed power “i” and acceleration power “j” MOEe = instantaneous fuel consumption or emission rate (l/s or mg/s) m = is a constant used to solve for the three headway constants (h/km) P = engine power (kW); qc = flow at capacity (veh/h) R = total resistance force (N); Ra = aerodynamic resistance (N) Rr = rolling resistance (N); Rg = grade resistance (N) u = vehicle speed (km/h); uf = free-speed (km/h) uc = speed at capacity (km/h); x = distance traveled (km) = power transmission efficiency (ranges from 0.89 to 0.94) = coefficient of friction between tires and pavement The study demonstrated that for steady-state conditions (no vehicle accelerations) the tool predicted vehicle fuel consumption and emission rates consistent to field data that were obtained from ORNL, and that vehicle fuel consumption and emissions are sensitive to the combined level of vehicle acceleration and speed. Furthermore, this study has demonstrated that the energy impacts of traffic signal control are marginally dependent on the level of acceleration, yet the environmental impacts of traffic signal control are highly dependent on the level of vehicle accelerations. The benefits of traffic signal control are within the level of variability in vehicle emissions that is associated with different acceleration levels. The findings of this study demonstrate the need to characterize typical vehicle acceleration levels under varying levels of congestion in order to develop reliable evaluation tools. Finally, the study demonstrates that aggressive driving behavior can result in significant environmental dis-benefits. • To demonstrate how the combination of traffic simulation model and an energy and emission model can be utilized to evaluate alternative ITS initiatives. • To demonstrate the sensitivity of vehicle fuel consumption and emission rates to different vehicle operating conditions, which the standard driving cycle-based emissions models do not capture.