Recent Results in Support Vector Machines
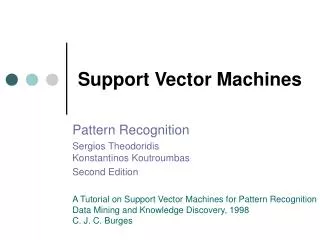
Recent Results in Support Vector Machines. Dave Musicant. Graphic generated with Lucent Technologies Demonstration 2-D Pattern Recognition Applet at http://svm.research.bell-labs.com/SVT/SVMsvt.html. Simple Linear Perceptron. Class -1. Class 1.

Recent Results in Support Vector Machines
E N D
Presentation Transcript
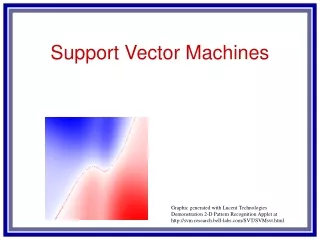
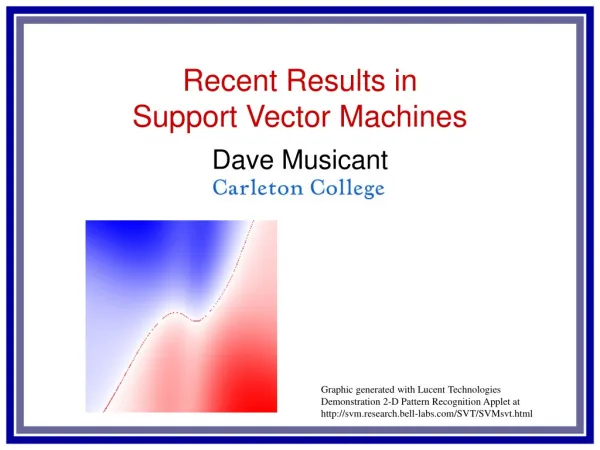
Recent Results inSupport Vector Machines Dave Musicant Graphic generated with Lucent TechnologiesDemonstration 2-D Pattern Recognition Applet athttp://svm.research.bell-labs.com/SVT/SVMsvt.html
Simple Linear Perceptron Class -1 Class 1 • Goal: Find the best line (or hyperplane) to separate the training data. How to formalize? • In two dimensions, equation of the line is given by: • Better notation for n dimensions: treat each data point and the coefficients as vectors. Then equation is given by:
Simple Linear Perceptron (cont.) • The Simple Linear Perceptron is a classifier as shown in the picture • Points that fall on the right are classified as “1” • Points that fall on the left are classified as “-1” • Therefore: using the training set, find a hyperplane (line) so that • This is a good starting point. But we can do better! Class -1 Class 1
Finding the Best Plane • Not all planes are equal. Which of the two following planes shown is better? • Both planes accurately classify the training set. • The solid green plane is the better choice, since it is more likely to do well on future test data. • The solid green plane is further away from the data.
Separating the planes • Construct the bounding planes: • Draw two parallel planes to the classification plane. • Push them as far apart as possible, until they hit data points. • The classification plane with bounding planes furthest apart is the best one. Class -1 Class 1
Recap: Finding the Best Plane • Details • All points in class 1 should be to theright of bounding plane 1. • All points in class -1 should be to theleft of bounding plane -1. • Pick yi to be +1 or -1 depending on the classification. Then the above two inequalities can be written as one: • The distance between bounding planes should be maximized. • The distance between bounding planes is given by: Class -1 Class 1
The Optimization Problem • The previous slide can be rewritten as: • This is a mathematical program. • Optimization problem subject to constraints • More specifically, this is a quadratic program • There are high powered software tools for solving this kind of problem (both commercial and academic) • These general purpose tools are slow for this particular problem
error Data Which is Not Linearly Separable • What if a separating plane does not exist? • Find the plane that maximizes the margin and minimizes the errors on the training points. • Take original inequality and add a slack variable to measure error:
The Support Vector Machine • Push the planes apart and minimize the error at the same time: • C is a positive number that is chosen to balance these two goals. • This problem is called a Support Vector Machine, or SVM.
Terminology • Those points that touch the bounding plane, or lie on the wrong side, are called support vectors. • If all the data points except the support vectors were removed, the solution would turn out the same. • The SVM is mathematically equivalent to force and torque equilibrium (hence the name support vectors).
Example from Carleton College • 1850 students • 4 year undergraduate liberal arts college • Ranked 4th in the nation by US News and World Report • 15-20 computer science majors per year • All research assistants are full-time undergraduates
Student Research Example • Goal: automatically generate “frequently asked questions” list from discussion groups • Subgoal #1: Given a corpus of discussion group postings, identify those messages that contain questions • Recruit student volunteers to identify questions • Learn classification • Work by students Sarah Allen, Janet Campbell, Ester Gubbrud, Rachel Kirby, Lillie Kittredge
Building A Training Set • Which sentences are questions in the following text? From: oehler@yar.cs.wisc.edu (Wonko the Sane) I was recently talking to a possible employer ( mine! :-) ) and he made a reference to a 48-bit graphics computer/image processing system. I seem to remember it being called IMAGE or something akin to that. Anyway, he claimed it had 48-bit color + a 12-bit alpha channel. That's 60 bits of info--what could that possibly be for? Specifically the 48-bit color? That's 280 trillion colors, many more than the human eye can resolve. Is this an anti-aliasing thing? Or is this just some magic number to make it work better with a certain processor.
Representing the training set • Each document is a point • Each potential word is a column (bag of words) • Other pre-processing tricks • Remove punctuation • Remove "stop words" such as "is", "a", etc. • Use stemming to remove "ing" and "ed", etc. from similar words
Results • If you just guess brain-dead: "every message contains a question", get 55% right • If you use a Support Vector Machine, get 66.5% of them right • What words do you think were strong indicators of questions? • anyone, does, any, what, thanks, how, help, know, there, do, question • What words do you think were strong contra-indicators of questions? • re, sale, m, references, not, your
Some datasets may not be best separated by a plane. How can we do nonlinear separating surfaces? Simple method: Map into a higher dimensional space, and do the same thing we have already done. Nonlinear SVMs Generated with Lucent TechnologiesDemonstration 2-D Pattern Recognition Applet athttp://svm.research.bell-labs.com/SVT/SVMsvt.html
Finding nonlinear surfaces • How to modify algorithm to find nonlinear surfaces? • First idea (simple and effective): map each data point into a higher dimensional space, and find a linear fit there • Example: Find a quadratic surface for • Use new coordinates in regular linear SVM • A plane in this quadratic space is equivalent to a quadratic surface in our original space
Problems with this method • If dimensionality of space is high, lots of calculations • For a high polynomial space, combinations of coordinates explodes • Need to do all these calculations for all training points, and for each testing point • Infinite dimensional spaces impossible • Nonlinear surfaces can be used without these problems through the use of a kernel function. • Demonstration: http://svm.cs.rhul.ac.uk/pagesnew/GPat.shtml