Download
1 / 48
480 likes | 620 Views
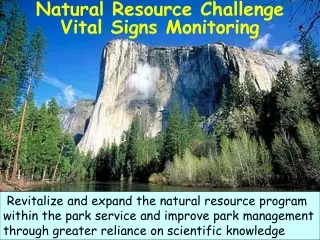
Natural Resource Challenge Vital Signs Monitoring. Revitalize and expand the natural resource program within the park service and improve park management through greater reliance on scientific knowledge. NPS Natural Resource Challenge Science for Parks - Parks for Science.

E N D
Natural Resource ChallengeVital Signs Monitoring Revitalize and expand the natural resource program within the park service and improve park management through greater reliance on scientific knowledge
NPS Natural Resource ChallengeScience for Parks - Parks for Science • Add natural resource stewardship to NPS visitor services capability • Learn what is in parks (inventories), and monitor the vital signs of natural systems • Engage the scientific community and the public, and facilitate their inquiries • Share the information widely
The Law: NATIONAL PARKS OMNIBUS MANAGEMENT ACT OF 1998 “The Secretary shall undertake a program of inventory and monitoring of National Park System resources to establish baseline information and to provide information on the long-term trends in the condition of National Park System resources. The monitoring program shall be developed in cooperation with other Federal monitoring and information collection efforts to ensure a cost-effective approach.” “The Secretary shall … assure the full and proper utilization of the results of scientific studies for park management decisions.
2001 NPS Management Policies “Natural systems in the national park system, and the human influences upon them, will be monitored to detect change. The Service will use the results of monitoring and research to understand the detected change and to develop appropriate management actions”. “The Service will: Identify, acquire, and interpret needed inventory, monitoring, and research, including applicable traditional knowledge, to obtain information and data that will help park managers accomplish park management objectives provided for in law and planning documents.”
Message from Congress: “This involves a serious commitment from the leadership of the National Park Service to insist that the superintendents carry out a systematic, consistent, professional inventory and monitoring program, along with other scientific activities, that is regularly updated to ensure that the Service makes sound resource decisions based on sound scientific data”. (FY2000 Appropriations Language)
NPS Advisory Board Report: “A sophisticated knowledge of resources and their condition is essential. The Service must gain this knowledge through extensive collaboration with other agencies and academia, and its findings must be communicated to the public. For it is the broader public that will decide the fate of these resources.” Source: Rethinking the National Parks for the 21st Century. A Report of the National Park System Advisory Board, July 2001
Provide funding and technical support to parks with significant natural resources LONG-TERM GOAL: Implement ecological monitoring in all units of the NPS. SHORT-TERM GOALS (as of 1992): 1. Complete baseline resource inventories. 2. Learn how to design and conduct monitoring programs.
12 Basic Inventory Datasets • Natural resource bibliography • Base cartographic data • Geology map • Soils map • Weather data • Air quality • Location of air quality monitoring stations • Water body location and classification • Water quality data • Vegetation map • Species list of vertebrates and vascular plants • Species distribution and status of vertebrates and vascular plants of high priority to each park
Prairie Cluster Prototype Monitoring Program A Network Success Story Uses of Plant Community Monitoring Data Prairie Cluster Monitoring Program • GMP planning meetings at PIPE and WICR • NRPP project proposal to manage shrubs at HOME • Cultural landscape report at WICR • Trail expansion planning at EFMO • Model for restoration seed mix at SCBL • Savanna restoration plan at EFMO • Trailside native plant signage at PIPE • Vegetation Mapping at EFMO
Using Monitoring Data in Management Decisions Alternate site for Trail Expansion at Effigy Mounds 4 Efmo, goat prairies Wicr, glade 3.5 Wicr, upland woods Wicr, restored prairie Home, restored prairie 3 Shannon Diversity Pipe, quartzite prairie Pipe, restored prairie 2.5 Efmo, north restoration Scbl, pine woodland Efmo, south restoration 2 Acres 0 20 40 60 80 100
Prairie restoration at Scott’s Bluff National Monument, Nebraska
Monitoring Results, Mixedgrass Prairie Restoration Scott’s Bluff National Monument Foliar cover of seeded grasses, native annuals & grasses, and exotic species Initial monitoring showed good establishment of seeded species, but exotics gradually increased; site was burned in spring to control cheat grass and other exotics
Monitoring the effects of prescribed fire on restoring the cultural setting for a Civil War battlefield at Wilson’s Creek
Monitoring Results: Manley Woodlands Wilson’s Creek National Battlefield (timing of prescribed fire changed to spring based on monitoring results) Relative frequency of ephemeral spring forbs Relative cover of cool season grasses and sedges
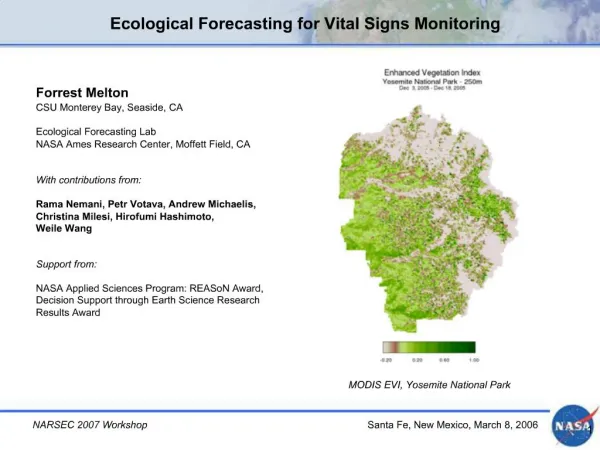
Goals of Vital Signs Monitoring • Determine status and trends in selected indicators of the condition of park ecosystems to allow managers to make better-informed decisions and to work more effectively with other agencies and individuals for the benefit of park resources. • Provide early warning of abnormal conditions of selected resources to help develop effective mitigation measures and reduce costs of management. • Provide data to better understand the dynamic nature and condition of park ecosystems and to provide reference points for comparisons with other, altered environments. • Provide data to meet certain legal and Congressional mandates related to natural resource protection and visitor enjoyment. • Provide a means of measuring progress towards performance goals.
Key Features of New Park/Network Monitoring Program (moving away from the stovepipe model) • Integrated monitoring program: physical and biological resources including weather, air, water, geoindicators, T&E species, exotic plants, other flora & fauna • Integrate NR information with other park operations including interpretation, maintenance, law enforcement • Emphasis on making information more useable; tools such as GIS Theme Manager, NR Database template, NPSpecies, Dataset Catalog, NatureBib Bibliography, interconnected web and distributed databases
Things to Keep in Mind • We are starting with a core program with shared personnel and funding - plan for future growth • Use funding for leveraging, cost sharing; augment with existing park staff, park base, partnerships • Demonstrate that data are useful for managing park resources and meeting the NPS mission • Partnerships are key to designing and building an integrated program • If more people use the data, there will be more support for the program. Share the results widely! Multiple products for multiple audiences.
Park Vital Signs Monitoring Funding from Servicewide Program will NOT allow comprehensive monitoring “Focus on most significant indicators of long-term ecological trends and highest concerns among the parks in each network”
What are Vital Signs? Vital Signs are key elements that indicate the health of an ecosystem. Vital signs may occur at any level of organization including landscape, community, population, or genetic levels. They may be compositional (referring to the variety of elements in the system), structural (referring to the organization or pattern of the system), or functional (referring to ecological processes). Vital signs can be any measurable feature of the environment that provides insights into the state of the ecosystem. “Focus on most significant indicators of long-term ecological trends and highest concerns among the parks in each network”
Ecological Indicators “Any environmental measurement that can be used to quantitatively estimate the condition of ecological resources” “One of the key challenges in designing a monitoring program is "to select for measurement those attributes whose values (or trends) best reflect the status and dynamics of the larger system" (Noon et al. 1999).
Current Guidance: • Data are collected primarily to provide managers with the data they need to manage park resources and work with their neighbors, re: decisions that benefit park resources • FIRST: Determine critical data needs and clearly define the questions. Who is interested in the monitoring data and why? • Use or modify standard protocols and existing programs wherever possible to allow sharing/comparing of data, IF they provide data needed to answer your questions. • Standardization and core indicators/vital signs will be developed and promoted where appropriate. • Servicewide programs: Develop guidance (sideboards), examples, templates, and mechanisms whereby we can all coordinate and learn from each other. Accountability!
What to Monitor? 1. Determine most critical data needs for the park 2. Answer the question, who is interested in the information, and Clearly defining and agreeing on the Goals and Objectives from the outset is critical to the success of the program!
Indicator Selection STRESSORS: Identify key agents of change FOCAL RESOURCES: Identify key resources of interest SYSTEM HEALTH: Identify key properties and processes Scoping Predict Stress/Response Relationships Predict Linkages among Components and Processes Conceptual Modeling List Potential Indicators Integration Establish Priorities Select Indicators Source: Kurt Jenkins, USGS/BRD Olympic Field Station
Conceptual Models A conceptual model is a visual or narrative summary that describes the important components of the ecosystem and the interactions among them. • Conceptual modelshelp us formalize our current understanding of natural processes and anthropogenic stressors affecting ecological integrity. • They help us to expand our consideration across traditional discipline boundaries. • Most importantly, clear, simple models facilitate communication among: - scientists from different disciplines; - researchers and managers; - managers and the public.
Conceptual Models Conceptual models define the linkages between environmental values, ecological endpoints, stressors, and important ecosystem components and processes. Conceptual models explicitly define the framework for indicator interpretation; for example, how the response indicators relate to the assessment endpoints … and how they will be used to assess that status. One purpose of the models is to promote an integrated program and facilitate coordination. Conceptual models are important representations of scientific understanding of the ecological resource for monitoring purposes. They must be descriptive and should clearly demonstrate linkages between the indicators and the environmental values being monitored.
The Case for Standardization • Standardization is a “sign of maturity” in the information age • Allows sharing and comparisons of data; putting your data into context; better interpretation of results • Allows roll-ups of data for reports to Congress and the Public • More efficient, coordinated development of methods, protocols, database design, analysis routines, reporting Monitoring Goals require a flexible program, but to the extent possible, Standards and Consistency should be promoted!
National Network/Ecosystem Park Servicewide Core Variables Network/Ecosystem Core Variables
Examples of Standardization • Air Quality • Water Quality - core variables, use of STORET • Vegetation Mapping classification system • Inventories: NPSpecies; Bibliography, Soils, Water • NPS Fire Effects monitoring • British Columbia standardized inventories • USDA Forest Service FIA and FHM (phase 3 of FIA) • USGS NAWQA program • EPA EMAP (Environmental Monitoring and Assessment Program) • Canadian EMAN (Ecological Monitoring and Assessment Network) National and Regional Inference Programs
Monitoring Themes • Coral reefs • Caves • Barrier islands • Wetlands • Alpine areas • Tundra • Deserts • Coniferous Forests
Current Approach • Parks and network identify most critical data needs, and determine partnership opportunities (maximize use and relevance of data). • Once that is done, identify common ground and additional opportunities for collaboration and consistency among approaches and data sets. • Promote sharing/comparing of protocols and datasets via data management and protocol clearinghouse. • At the national level, use qualitative measures and in a few cases, standardized quantitative measures, to report on the condition of natural resources and important highlights and trends Servicewide.
Tasks that Need to Be CompletedBefore Monitoring Field Work Begins: • Clearly define Goals and Objectives • Develop Monitoring Protocols • Design Field Data Forms • Design Database • Write Data Management Plan • Determine Data Analysis Procedures • Determine Content, Audiences for Reports
NPS Natural Resource Challenge The NPS, for the first time, is developing a data management capability at the park, regional and national levels that will allow parks to make better use of existing data as well as making new data available to managers, researchers, the public and others.
Integrated Natural Resource Data Management Framework Permits/IAR ITIS, USFWS NatureServe Master web-based databases (Oracle) NatureBib Links to other databases Dataset Catalog NPSpecies Download Download NatureBib Dataset Catalog Database Template NPSpecies Distributed versions in MS Access ArcView-Access Link Tool GIS Theme Manager
Monitoring Protocols? • Necessary for the program to be credible, so that data stand up to external review • Necessary to detect changes over time and for the program to survive changeovers in personnel • Necessary to allow comparisons of data among places/agencies “A key component of Quality Assurance to ensure that data meet defined standards of quality with a stated level of confidence”
Web-based Clearinghouse of Protocols and Database Components * Database is an MS Access .mdb file with tables, queries, forms, reports designed for a particular protocol.
7-step Approach for Developing a Network Monitoring Program • Form a Board of Directors and a technical committee to lead/advise the process. • Summarize existing data and understanding • Prepare handouts and draft conceptual models for scoping workshop, “Straw man” (1st 3 bullets comprise Phase 1 report) • Hold a scoping workshop for additional input and peer review. • Workshop report is written and widely reviewed. • Board of Directors makes decisions on priorities and implementation. • Draft monitoring plan is prepared, reviewed and approved
3-Phase Monitoring Design • Phase 1: Background work prior to selecting vital signs • goals and objectives for monitoring • identify, evaluate, synthesize existing data and understanding (identify and catalog existing data sets) • draft conceptual models • Phase 2: Initial selection and prioritization of vital signs • update and expand upon Phase I work; select vital signs • (Phase 2 report satisfies GPRA Goal 1b3 “identify vital signs”) • Phase 3: Development of full monitoring plan • Detailed design work; protocols, spatial sampling design • Design database • Write Data Management Plan
Timeline for Monitoring Design(core vital signs and water quality monitoring) First 12 networks: Phase 1: October 1, 2002 Phase 2: April 1, 2003 Phase 3: April 1, 2004 Next 5 networks (startup funds in FY 02): Phase 1: April 1, 2003 (1 1/2 years) Phase 2: October 1, 2003 (2 years) Phase 3: October 1, 2004 (3 years)
Included in Phase 1 Report: • Draft lists of important management issues for each park; • Draft lists of important natural resources and focal species or processes for each park; • Draft lists of known stressors that may cause changes in park resources; • Draft conceptual models of portions of the ecosystem that are relevent to the monitoring program; • Draft list of measurable objectives for the monitoring program; • Criteria for indicator ranking and selection
Outline for Vital Signs Monitoring Plans • Executive Summary • Introduction and Background • purpose, goals, objectives, important issues, overview of park resources, overview of past/current monitoring by parks and adjacent agencies. Who is interested in the monitoring information, and why? • Conceptual Models (of park ecosystem, focusing on aspects relevant to the proposed monitoring) • Vital Signs • justification for vital signs selected, and those not selected; specific, measurable objectives, including “trigger points” or thresholds wherever possible • Sampling Design • overall design that allows inferences to be made to larger areas; define populations and sampling units being sampled; stratification and collocation issues Phase 1 Report
Outline for Vital Signs Monitoring Plans • Sampling Protocols • overview of sampling protocols to be used (include most of items in protocol narrative outline) • Data Management • describe process for entering, storing, archiving; attach data management plan as an appendix • overview of database design (MS Access) • Data Analysis and Reporting • data analysis procedures • describe reports and other products; who are they for, what will they include, how often, who is responsible for producing them? • Administration/Implementation of the Monitoring Program • describe makeup of BOD and technical committees; staffing plan; integration of monitoring with other park operations; partnerships; reviews • Schedule - frequency of sampling, what season; target dates for protocols to be developed • Budget; Literature Cited; Appendices
Reporting the Results of I&M EffortsMaking Data, Information Available for Decision-Makers, Scientists, Educators, and various Constituency Groups • Annual Administrative Report and Work Plan • Annual Reports for specific Protocols or Projects • Inventory Project Reports • Analysis and Synthesis reports – trends • Program and Protocol Review reports • Scientific journal articles and book chapters • Symposia, workshops and conferences • National Report - Condition of NR in National Parks • Websites