Download
1 / 8
80 likes | 104 Views
Discover the development and production of information-related goods, their impact on economic growth, and the input-output models reflecting their importance across sectors. Explore cost savings, productivity increases, and advancements in technology.

E N D
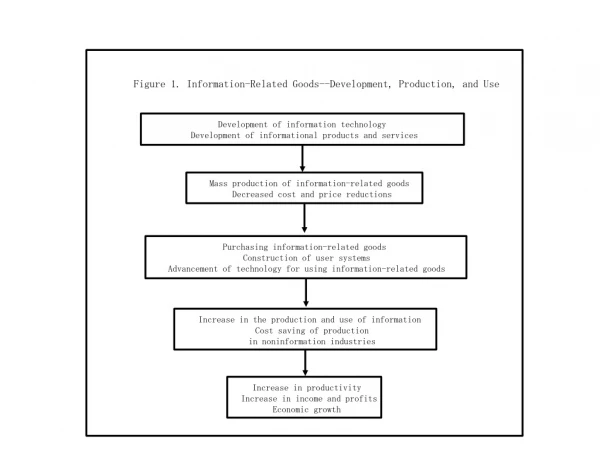
Figure 1. Information-Related Goods--Development, Production, and Use Development of information technology Development of informational products and services Mass production of information-related goods Decreased cost and price reductions Purchasing information-related goods Construction of user systems Advancement of technology for using information-related goods Increase in the production and use of information Cost saving of production in noninformation industries Increase in productivity Increase in income and profitsEconomic growth
(Industrial sectors) Figure 2. Input-Output Model (Final demand) Primary sectors Consumption Tertiary sectors Investment Secondary sectors Exports (Intermediate products) (Factor inputs) Labor Capital (Exogenous sectors: household, government, Imports capital accounts, and the rest of the world)
Information-Related Goods) Figure 3. Input-Output Model (Production of Information, Information Services, (Industrial sectors) Primary sectors Consumption Information-related service sectors Tertiary Information sectors sectors Investment Noninformation Information-related service sectors Secondary Exports good sectors sectors (Including final demand Other sectors for information, information services, and information-related goods) Labor Capital Imports (Exogenous sectors)
Figure 4. Input-Output Model According to Information- and Noninformation -Sectors Classification (Production of Information Within Firms Are Included) (Primary information) (Industrial sectors) Noninformation sectors Consumption (including production of infomation within firms) (including production of information within households) Information-related service sectors and information sectors (including production Investment of information within firms) (Primary information) Information-related good Exports sectors (including production of information within firms) Labor Capital Imports (Exogenous sectors)
into Information and Other Components Unite price of a car Figure 5. Division of the Unit Price of a Passenger Car Design and tests Management, marketing, and sales Others Parts and materials Assembly and other services Costs of LSI Others in moter Costs of using Others robots Costs of using Costs of testing CAD/CAM for Others and simulations designing Costs of Costs of using Others using PC VAN services Others
The price of a passenger car The cost of using robots Figure 6. Information Components in the Price of a Passenger Car Traced Backward The price of robots The price of softwares for robots The cost of using a workstationfor writing robot softwares The price of workstations The price of LSI in workstations The cost of using facilities for LSI production The price of facilities for LSI production
and Noninformation Sector (Information Components Exhibited) H: Information Components Figure 7. Input-Output Model with 2-Sectoral Classification: Information Sector Z: Other Components (Industrial sectors) Consumption (H Component) Noninformation sector Information sector (Z Component) (Sector Z) (Sector H) Investment (H Component) (Z Component) H H Labor Labor Z Z H H Capital Capital Z Z Research and development (Z) Research and development (Z) (Exogenous sectors)
of the Japanese Economy into Information and Noninformation Components 6 5 4 3 2 1 0 1975 1976 1977 1978 1979 1980 1981 1982 1983 1984 1985 GNP Labor(H) Labor(Z) Capital(H) Capital(Z) Growth rate (% per year) Figure 8. Decomposition of the Growth Year Fig-8.ch1