Renewable Energy: Realistic Candidates and Future Trends
160 likes | 176 Views
Discover the tangible and intangible benefits of renewable energy sources like wind, biomass, and solar presented at the IPED Coal Power Conference in St. Petersburg. Explore capacity trends from 1999 to 2006 and projections for wind and biomass energy. Learn the advantages of wind turbines and biomass processes, as well as the intangible benefits of renewable energy. Find out about state renewable portfolio standards, greenhouse gas drivers, and energy independence. Uncover conclusions on the most commercially viable renewables and the projected increase in renewable energy capacity. Contact David L. Patton for more information and questions regarding renewable energy policies and continuity.

Renewable Energy: Realistic Candidates and Future Trends
E N D
Presentation Transcript
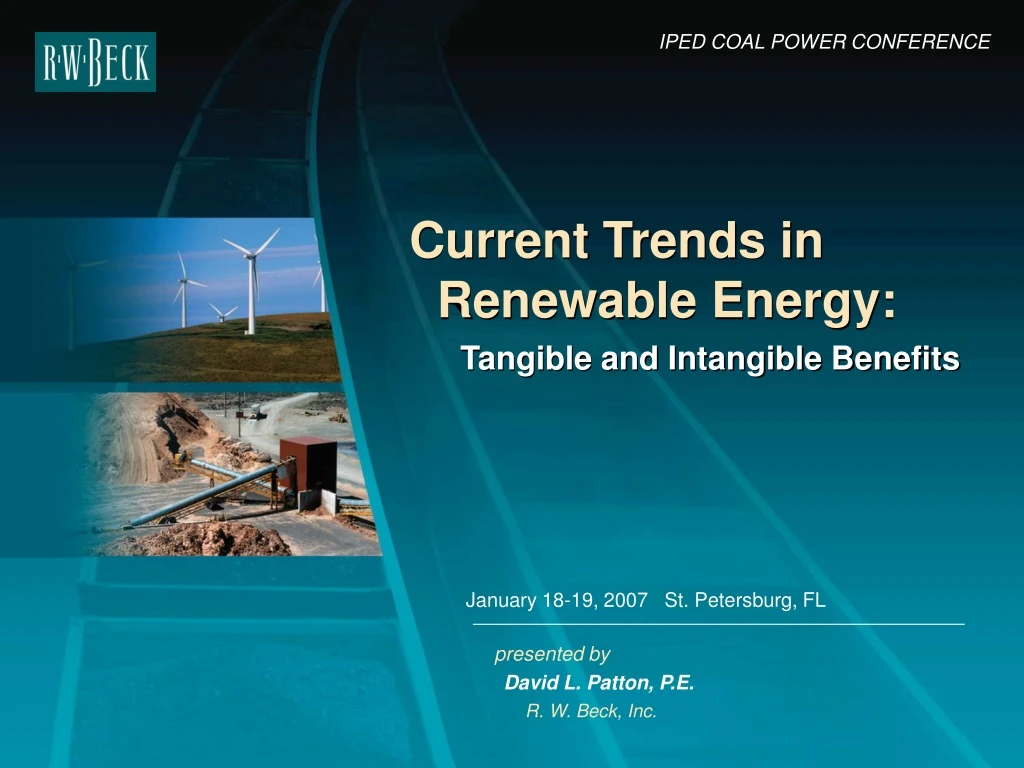
IPED COAL POWER CONFERENCE Current Trends in Renewable Energy: Tangible and Intangible Benefits presented by January 18-19, 2007 St. Petersburg, FL David L. Patton, P.E. R. W. Beck, Inc.
Which Renewable Candidates are Realistic Now? • Wind • Biomass • Fuel Cells • Geothermal • Hydro • Ocean (Tidal, OTEC) • Solar (PV, Thermal)
Biomass (Total) Wood/Wood Waste MSW/Landfill Gas Geothermal Other Biomass Solar Wind Renewable Energy Capacity Trend,1999 - 2006 14,000 12,000 10,000 8000 Installed Capacity, MW 6000 4000 2000 0 2006 2000 2001 2002 2003 2004 2005 Year Source: U.S. DOE EIA, August 2005
U.S. Renewable Electric Generating Capacity 2005 Coal 23% Nuclear Biomass 8% 46% Natural Gas 23% Renewables 6% Conventional Hydroelectric 46% Geothermal 5% Wind 2% Petroleum Fuels Solar 40% 1% Source: U.S. DOE EIA, January 2007
Wind Energy – Tangible Benefits • No Fuel Price Uncertainty • No Fuel Cost • Low Operating Cost • Relatively Less Complex • Mature Wind Turbine Technologies • Addresses Environmental Issues • Lease Payments Support Family Farms • Government Financial Incentives & Grants
U.S. Annual Average Wind Resources Map Source: NREL
U.S. Annual Wind GeneratingCapacity: Installed and Projected 3500 3250 3000 2750 2500 2250 2000 1750 MW Installed During Year 1500 1250 1000 750 500 250 0 2007 (projected) 1981 1983 1985 1987 1989 1991 1993 1995 1997 1999 2001 2003 2005 Source: U.S. DOE Wind Energy Program and AWEA
Biomass Energy – Tangible Benefits • Lower Fuel Costs • Addresses Environmental Issues • Domestic Sources • Local Economic Benefits • Mature Biomass/Biogas Process Technologies • Government Financial Incentives & Grants
Biomass Resource Availability Biomass Fuel for Generation is Widespread Within Most States MA, CT, RI, NJ, DE, MD, DC States with Renewable Portfolio Standards (RPS) / Goals Source: NREL and PEW Center, Global Climate Change
States with Renewable Portfolio Standards (RPS) / Goals Source: NREL and PEW Center, Global Climate Change
Intangible Benefits – All Renewables • Positive Public Image • Desire for Diversified Portfolio • Public Support/Perception • Political Support • Greenhouse Gas Drivers • Energy Independence / Security • Offset Emissions from “Dirtier” Energy Sources
RPS Goals vs. Renewable Status * As a percent of state generation or actual generation / use. Source: U.S. DOE EIA & PEW Central Global Climate Change, December 2006
Summary • Realistic Renewable Candidates • Renewable Energy Capacity Trends • Recent Renewable Capacity • Wind Energy – Tangible Benefits • Biomass Energy – Tangible Benefits • Intangible Benefits – All Renewables • RPS Goals
Electricity Generation by Fuel, 1980-2030 (billion kilowatt hours) 4000 History Projections Coal 3000 2000 Natural Gas 1000 Nuclear Renewables Petroleum 0 1980 2020 2030 2005 1990 Source: U.S. DOE EIA
Conclusions • Biomass and Wind are Currently the Most Commercially Realistic Renewables • 25,000 to 50,000 Megawatts New Renewable Energy Capacity Nationwide in Next Decade • Policy Consistency and Continuity
IPED COAL POWER CONFERENCE Questions David L. Patton, P.E. R. W. Beck, Inc. dpatton@rwbeck.com (508) 935-1811