Download
1 / 67
670 likes | 776 Views
Learn about osmosis and dialysis experiments, including concepts, procedures, and data analysis. Enhance your understanding of membrane transport and solute separation techniques.

E N D
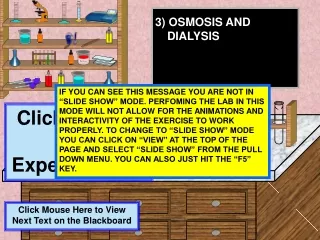
3) OSMOSIS AND DIALYSIS Sucrose IF YOU CAN SEE THIS MESSAGE YOU ARE NOT IN “SLIDE SHOW” MODE. PERFOMING THE LAB IN THIS MODE WILL NOT ALLOW FOR THE ANIMATIONS AND INTERACTIVITY OF THE EXERCISE TO WORK PROPERLY. TO CHANGE TO “SLIDE SHOW” MODE YOU CAN CLICK ON “VIEW” AT THE TOP OF THE PAGE AND SELECT “SLIDE SHOW” FROM THE PULL DOWN MENU. YOU CAN ALSO JUST HIT THE “F5” KEY. Click Here To Start Experiment #3 Click Mouse Here to View Next Text on the Blackboard
To magnify the blackboard click on it to view a discussion on membrane transport There are two parts to this experiment # 3. PART 1 will consider OSMOSIS and PART 2 will consider DIALYSIS. You will need to supply the following in your lab report for experiment # 3 Part 1 (Osmosis) Table of Osmotic Potential and Time Graph of Osmotic Potential vs Time Graph of Osmotic Change vs Time (Osmotic Rate) Answers to Questions (1 - 7) Part 2 (Dialysis) Table of Dialysis Tests Answers to Questions (1 - 6) Click Mouse Here to View Next Text on the Blackboard
OSMOSIS is the diffusion of water through a selectively permeable membrane. Water will generally move quite freely through the cell membrane by diffusion. Osmotic movement of water occurs when the solute (non-penetrating) concentrations differ between the opposing sides of the cell membrane. A difference in solute (non-penetrating) concentrations means there is a difference in water concentrations and water will move from the region of higher concentration to a region of lower concentration. Click Mouse Here to View Next Text on the Blackboard
For example, water osmotically moves into a cell when the fluid outside the cell has more water (less solutes) than the fluid inside the cell. In this case, as water moves into the cell, it swells as the water pressure inside the cell increases. Red Blood Cell Distilled Water Click Mouse Here to View Next Text on the Blackboard
DIALYSIS is the separation of solutes according to their size by diffusion through a permeable membrane. Depending upon the molecular pore size of the membrane, solutes will either diffuse across the membrane or be restricted by their size. The device you will be using to collect data for the experiments is an osmometer. This is a device used to measure osmotic force. Click Mouse Here to View Next Text on the Blackboard
PART 1 (OSMOSIS) MATERIALS Thistle tube (with mm markings) Thistle tube stand Dialysis tubing (selectively permeable membrane) Rubber band Sugar solution (20 % sucrose) Beaker Click Mouse Here to View Next Text on the Blackboard
When you are finished with PART 1 of experiment # 3, be sure that you include the following with your lab report. Table of Osomotic Potential and Time Graph of Osmotic Potential vs Time Graph of Osmotic Change vs Time (Osmotic Rate) Answers to Questions (1 - 7) Click Mouse Here to View Next Text on the Blackboard
Sucrose Sucrose H2O H2O You will need to record your data from this experiment on a data table. You can access the data table by clicking on the link to the right. Click Mouse Here to Access the Data Table Click Mouse Here to View Next Instructions on the Blackboard
STAND Sucrose Sucrose H2O H2O Procedure Click on the thistle tube stand in order to bring it to the table You will know you are pointing to the stand when the cursor changes. Click Mouse Here to View Next Instructions on the Blackboard
Sucrose Sucrose H2O H2O Thistle tube Now click on the thistle tube funnel to attach it to the tube stand. Click Mouse Here to View Next Instructions on the Blackboard
Tubing Sucrose Sucrose H2O H2O Next we will put the dialysis tubing on the bulb end of the thistle tube. You will need only a small piece. Click on the dialysis tubing on the shelf. Click Mouse Here to View Next Instructions on the Blackboard
Sucrose Sucrose H2O H2O Rubber Band Put a rubber band on the tube and dialysis tubing to hold it in place. You can accomplish this by clicking on the rubber bands on the shelf. Click Mouse Here to View Next Instructions on the Blackboard
Sucrose Sucrose H2O H2O Put the bulb of the thistle tube into the beaker of water. The water is distilled which means that it has no solutes in it (100 % water). Click on the beaker labeled as H2O. Click Mouse Here to View Next Instructions on the Blackboard
Sucrose Sucrose Now we will pour the sucrose solution into the thistle tube from the top. The sucrose solution is a 20 % sugar solution (80 % water). Click on the beaker labeled as Sucrose. Click Mouse Here to View Next Instructions on the Blackboard
33 30 26 22 16 START Record the original millimeter measurement of the sucrose solution in the column of the thistle tube on your data sheet. Next, record the movement of the sucrose solution every 15 minutes for 90 minutes. Click on the start button of the clock to begin measuring. 10 00:00 55:00 65:00 25:00 30:00 35:00 40:00 45:00 50:00 10:00 75:00 70:00 15:00 80:00 85:00 90:00 05:00 20:00 60:00 3 Click Mouse Here to View Next Instructions on the Blackboard
From the data you have collected you will need to produce two graphs. One of the graphs will plot Osmotic Potential vs Time. The other graph will plot Osmotic Change vs Time. Graph of Osmotic Potential vs Time Graph of Osmotic Change vs Time You may want to print the two links above to produce your graphs. Click Mouse Here to View Next Instructions on the Blackboard
When you have finished your graphs you can compare them with the two links below. Yours should be very similar to these. Completed Graph of Osmotic Potential vs Time Completed Graph of Osmotic Change vs Time Click Mouse Here to View Next Instructions on the Blackboard
Answer the following questions about the experiment you have performed. Be sure to include the answers in your lab report. Questions 1 - 7 on Osmosis and Dialysis Click Mouse Here to View Next Instructions on the Blackboard
When you are finished with part 1 of experiment # 3, be sure that you include the following with your lab report. Table of Osomotic Potential and Time Graph of Osmotic Potential vs Time Graph of Osmotic Change vs Time (Osmotic Rate) Answers to Questions (1 - 7) Click Mouse Here to View Next Text on the Blackboard
You are now ready to begin part two of experiment #3. In this part we will be concerned about a process related to osmosis called Dialysis. Lugol’s Lugol’s Glucose Glucose Starch H2O H2O Starch Click Mouse Here to View Next Instructions on the Blackboard
Dialysis is the diffusion of a solute (salt, glucose, etc.) across a selectively permeable membrane. In this case the solute molecules always move from the stronger concentration (hypertonic) to the weaker (hypotonic). To magnify the blackboard click on it to view a discussion about dialysis Click Mouse Here to View Next Instructions on the Blackboard
Dialysis involves the movement of some, but not all, of the dissolved substances in a solution. The substance that moves has small molecules, so these can pass through the pores in the membrane, but other substances, with larger molecules, cannot escape. The green molecules are small enough to fit through the pores of the semi permeable membrane while the red molecules are too large. Click Mouse Here to View Next Instructions on the Blackboard
This process occurs normally in the kidney. Substances with small molecules, such as salts, glucose and urea, continuously pass out of the blood through a membrane under pressure, but useful substances are later reabsorbed. Waste substances are then excreted as urine. Kidney Click Mouse Here to View Next Instructions on the Blackboard
In this exercise you will measure diffusion of small molecules through dialysis tubing, an example of a semi permeable membrane. The movement of a solute through a semi permeable membrane is called dialysis. The size of the minute pores in the dialysis tubing determines which substance can pass through the membrane. The light blue object here represents a section of dialysis tubing. The red spheres represent molecules which are able to move through the dialysis membrane, while the blue spheres represent molecules too large to move out of the dialysis membrane solution. Click Mouse Here to View Next Instructions on the Blackboard
A solution of glucose and starch will be placed inside a bag of dialysis tubing. Distilled water will be placed in a beaker, outside the dialysis bag. The dialysis bag with the starch glucose solution will be inserted into the beaker of distilled water. After 30 minutes have passed, the solution inside the dialysis tubing and the solution in the beaker will be tested for glucose and starch. The presence of glucose will be tested with glucose test strips. The presence of starch will be tested with Lugol's solution (iodine potassium iodide). Click Mouse Here to View Next Instructions on the Blackboard
PART 2 (DIALYSIS) MATERIALS 30 cm section of dialysis tubing String 15 % glucose solution 1 % starch solution Glucose test strips Lugol’s solution Distilled water 2 Test tubes Large beaker Click Mouse Here to View Next Instructions on the Blackboard
When you are finished with Part 2 of experiment # 3, be sure that you include the following with your lab report. Table of Dialysis Tests Answers to Questions (1 - 6) Click Here to Access a Table of Dialysis Tests Click Mouse Here to View Next Text on the Blackboard
Procedure Obtain a 30 cm piece of dialysis tubing Click on the tubing to obtain the dialysis tubing Lugol’s Lugol’s Tubing Glucose Glucose Starch H2O H2O Starch Click Mouse Here to View Next Instructions on the Blackboard
We will now tie one end of the dialysis tubing with the string. Click on the string to tie the tubing Lugol’s Lugol’s Glucose Glucose Starch H2O H2O Starch String Click Mouse Here to View Next Instructions on the Blackboard
We can now place the dialysis tubing in distilled water to moisten it so that it will be easier to open. Click on the beaker of distilled water to bring it to the table then click on the dialysis tubing to place the tubing in the water. Lugol’s Lugol’s Glucose Glucose Starch H2O H2O Starch Click Mouse Here to View Next Instructions on the Blackboard
While we let the dialysis tubing soak, we can access the glucose and starch solutions. Bring the two solutions to the table by clicking on either of them. Lugol’s Lugol’s Glucose Glucose Starch H2O Starch Starch Glucose Click Mouse Here to View Next Instructions on the Blackboard
We will need to develop a method to test for glucose in a solution as well as test a solution for starch. Lugol’s Lugol’s Glucose H2O Starch Starch Glucose Click Mouse Here to View Next Instructions on the Blackboard
Use a table like the one you see below to record your results. You can use the link supplied below to view a table which can be printed. Lugol’s Lugol’s Click Mouse Here to View Next Instructions on the Blackboard Glucose H2O Starch Starch Glucose Click Here to View a Printable Version of This Table
We will be using glucose test strips to test a solution for the presence of glucose. When the strip is exposed to glucose it will change color from yellow to blue. Lugol’s Lugol’s Glucose H2O Starch Starch Glucose Click Mouse Here to View Next Instructions on the Blackboard
We will be using Lugol’s solution to test for the presence of starch. When Lugol’s solution is in the presence of starch the solution will change to a dark blue color. Lugol’s Lugol’s Glucose H2O Starch Starch Water Click Mouse Here to View Next Instructions on the Blackboard
Click on the test strips to bring them to the table. Next we will test the Glucose solution and the distilled water where the dialysis tubing is now soaking for the presence of glucose. Lugol’s Lugol’s Glucose Test Strips H2O Starch Starch Glucose Click Mouse Here to View Next Instructions on the Blackboard
Click on one of the glucose test strips. You will be testing the glucose solution for the presence of glucose. As you have predicted, you will get a positive test. Record your data. Lugol’s Lugol’s Glucose H2O Starch The color change on the strip shows a positive test for the presence of glucose Starch Glucose Click Mouse Here to View Next Instructions on the Blackboard
Click on another test strip to test the distilled water for the presence of glucose. Remember a positive test will turn the yellow end of the strip to blue. Record your results in your data table. Lugol’s Lugol’s Glucose H2O Starch Record your data Starch Glucose Click Mouse Here to View Next Instructions on the Blackboard
Next we will test for starch in the starch solution and the distilled water. You will be using Lugol’s solution to test for starch. If starch is present the solution will turn a dark blue color. Lugol’s Lugol’s Glucose H2O Starch Starch Glucose Click Mouse Here to View Next Instructions on the Blackboard
Click on the blue bottle of Lugol’s solution on the shelf to bring it to the table. You will need a test tube to test a small portion of the starch solution. Next click on the test tube rack. Lugol’s Lugol’s Glucose Test tube H2O Starch Starch Glucose Click Mouse Here to View Next Instructions on the Blackboard
Click on one of the eyedroppers on the shelf to add starch to the test tube. Next click on the eyedropper in the bottle of Lugol’s solution to add a few drops to the starch solution in the test tube. Record your results on your data sheet. Lugol’s Glucose H2O Starch Eye Dropper Starch Glucose Click Mouse Here to View Next Instructions on the Blackboard
Next we will test the distilled water for the presence of starch. Click on the test tube rack to get a clean test tube Lugol’s Glucose H2O Starch Starch Glucose Click Mouse Here to View Next Instructions on the Blackboard
Click on a fresh eyedropper from the shelf to add distilled water to the test tube. Lugol’s Glucose H2O Starch Starch Glucose Click Mouse Here to View Next Instructions on the Blackboard
Next click on the eyedropper in the Lugol’s solution to add a few drops to test for starch. Record your results. Lugol’s Glucose H2O Starch Starch Glucose Click Mouse Here to View Next Instructions on the Blackboard
Next we will open the dialysis tubing and fill it with about ½ full of starch solution and about ½ full of glucose solution. Leave enough of the tubing so that you can tie the end shut. Lugol’s Glucose H2O Starch Starch Glucose Click Mouse Here to View Next Instructions on the Blackboard
Click on the dialysis tubing in the distilled water beaker to remove it so that it can be opened. Next click on the starch or glucose solution to fill the dialysis tubing. Lugol’s Glucose H2O Starch Starch Glucose Click Mouse Here to View Next Instructions on the Blackboard
Next click on the yellow string to tie the top of the dialysis bag. Lugol’s Glucose H2O Starch Click Mouse Here to View Next Instructions on the Blackboard
Now click on the dialysis bag to insert it into the distilled water. Leave the dialysis bag in the distilled water for 30 minutes. Click the start button on the timer. Lugol’s Glucose H2O Starch START 00:00 05:00 10:00 15:00 20:00 25:00 30:00 Click Mouse Here to View Next Instructions on the Blackboard
Remove the dialysis bag by clicking on it. Open one end of the dialysis tubing by clicking on the yellow string holding one end together Lugol’s Glucose H2O Starch Click Mouse Here to View Next Instructions on the Blackboard
Click on the test tube rack to obtain a test tube. We will add a small amount of solution from the dialysis tubing to the test tube to test for glucose and starch. Lugol’s Glucose H2O Starch Click Mouse Here to View Next Instructions on the Blackboard