Download
1 / 24
240 likes | 263 Views
Explore a model capturing oligopolistic industries dynamics, analyzing market structures, welfare implications, and equilibrium strategies. Study multi-product and vertically related firms' impact on product variety, prices, and profits. Investigate economies of scope effects on consumer surplus and total welfare.

E N D
Equilibrium Structure in Successive Oligopoly with Multiproduct Firms ChrysovalantouMilliou, Emmanuel Petrakis, & Igor Sloev Dept. of International & European Economic Studies, Athens University of Economics and Business Department of Economics, University of Crete, & Department of Management, NRU Higher School of Economics July 2012, Nignij Novgorod
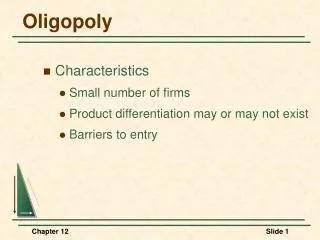
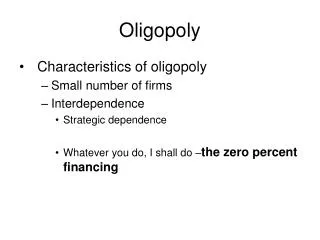
Ι. Motivation A number of industries are characterized by: • A small number of Upstream Firms/ Manufacturers → oligopolistic structure in the upstream sector • Each Upstream Firm produces a spectrum of horizontally differentiated goods • A small number of Downstream Firms/Retailers, each selling most (or even all) of the manufacturers products → oligopolistic structure in retailing • Intensive Product Creation Activities at the upstream sector → enhancement of product variety
Ι. Motivation (cont’d) • We develop a successive oligopoly model that captures some of the characteristics of the above industries in order to address the following issues: • The manufacturers incentives to enter in the upstream market and invest in new product creation processes • The impact of the downstream tier concentration on product variety offered in the market, upstream market concentration, wholesale prices and output quantities sold in the market. • The impact of the intensity of the economies of scope on product variety offered in the market, upstream market concentration, wholesale prices and output quantities sold in the market. • The welfare implications of economies of scope i.e. their impact on consumer surplus, upstream and downstream profits and total welfare
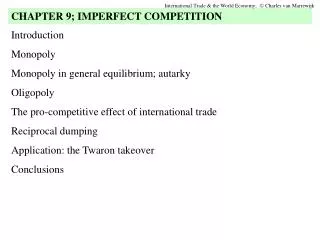
I. Related Literature • Literature on Multi-product Firms • Helpman (1985), Nocke and Yeaple (2006), Anderson and de Palma (1992, 2006), Ottoviano and Thisse (1999) … • (They consider one-tier industries) • Literature on Vertically Related Industries • Reisinger and Schnitzer (2008), Smith and Thanassoulis (2008), Dobson and Waterson (2007), … • (They consider single-product upstream firms)
II. Market Structure • Upstream manufacturer m = 1,…,M produces nmdifferent goods. Total number of goods is N = n1 + n2 + … + nM • Downstream retailer r = 1,…,R resell all Ngoods. • Representative consumer has the linear-quadratic quasilinear utility function.
II. The Model (market structure) M1 MM R1 RR Final Consumers
II. The Model (1) Utility function of the representative consumer: (1) • a reflects the size of the market. • 1 > β > γ > 0: represents the degree of product substitutability • L: represents the income spent on the rest of goods. Hence, the system of the demand functions is: (2)
II. The Model (2) • Retailers: • R downstream firms/retailers, r =1,…,R, each selling all the manufacturers’ goods. • Each retailer r chooses the quantity of each good that he buys from each manufacturer and resells it to the final consumers, qi. • The total quantity of good i sold in the market by all retailers is • Qi=∑ r qi r, i= 1,…,N. • There are no reselling costs, thus the retailing marginal cost for each good is equal to the manufacturer’s wholesale price • w =(w1,…,wN).
II. The Model (3) The retailer r maximizes its profit function given wholesale prices w: (3) (4) where The solution of retailer problems is It determines the demand system for upstream manufacturers goods for all possible wholesale pricesw: (5)
II. The Model (4) • Manufactures: • Each manufacturer m = 1,…,M decides how many differentiated goods to produce, nm. The total number of goods produced is • N = n1 +…+ nm. • Each manufacturer m sets the quantity of each good he produces correctly anticipating the price system determined by (5): • The cost function of each m is TC = F n + G. The lower F or/and the higher G, the stronger economies of scope in the new product creation process. Manufacturer m maximizes its profit function: (6) (7)
ΙII. Equilibrium Strategies and timing. (1) Each Manufacturer m’s sets its product variety and outputs {nm, Qm}; (2) For given manufacturers’ outputs, market generates prices w; (3) Retailers choose their outputs qr, r = 1,…,R, given prices w. We solve by backward induction, SPNE (at equilibrium path): a) Given w and N,we obtain the solution of retailers’ problem qi(w); b) This provides the demand for manufacturers’ goods wi(q); c) Finally manufacturer m’s maximization problem provides {nm, Qm}, with
ΙII. Solution FOCs + symmetry (qir = qi): Now, for given nmeach m solves The FOCs: Gives Finally, provides nm = n* .
IV. Equilibrium Analysis • Case 1: Number of manufacturers (M) is given In the symmetric equilibrium individual variety, output of each good and wholesale price are :
IV. Equilibrium Analysis Case 1: Number of manufacturers (M) is given In the symmetric equilibrium prices, profits of manufacturers and retailers are:
IV. Results • The lower upstream market concentration (the higher M), • the lower product variety of each manufacturer (n); • the lower manufacturers’profits; • the higher the total number of goods produced (M n); • the higher retailers’ profits; • the lower wholesale prices (w) and final price (P); • the higher consumer surplus.
IV. Results • The lower concentration of the downstream market (the higher R), • the higher the product variety of each manufacturer (n); • the higher manufacturers’profits; • the higher the total number of goods produced (M n); • the lower retailers’ profits; • the lower wholesale prices (w); • the lower final price (P).
V. Equilibrium Analysis: Free Entry Case 2: Free-entry in the upstream sector In the symmetric equilibrium the number of manufacturers, wholesale prices, individual varieties are :
V. Equilibrium Analysis: Free Entry Case 2: Free-entry in the upstream sector In the symmetric equilibrium the total variety, and quantity of each good are:
V.Results • The lower concentration of the downstream market (the higher R), • the higher the number of manufacturers (M); • The higher product variety of each manufacturer (n); • the higher the output of each good (Q); • the higher the total number of goods produced (M n); • the lower retailers’ profits; • the lower wholesale prices (w); • the lower final price (P); • the higher consumer surplus (CS).
V. Results • The lower the per-variety fixed cost F, • the higher the number of manufacturers (M); • the higher product variety of each manufacturer (n); • the lower the output of each good (Q); • the higher the total number of goods produced (M n); • the higher retailers’ profits; • the lower wholesale prices (w); • the lower final prices (P).
V. Results • The higher the firm-level fixed cost G, • the lower the number of manufacturers (M); • the higher product variety of each manufacturer (n); • the lower the total number of goods produced (M n); • the lower retailers’ profits; • the higher wholesale prices (w); • the higher final prices (P).
V.Results • The higher the market size a, • the higher the number of manufacturers (M); • the higher the total number of goods produced (M n); • the higher retailers’ profits; • the lower final prices (P); • the higher consumer surplus. • However, • product variety of each manufacturer (n), • wholesale prices (w), • the output of each good (Q) • do not depend on a;
XII. Conclusions • We have developed a successive oligopoly model where multi-product manufacturers sell their differentiated goods to a given number of retailers, which in turn resell them to final consumers. • Both the cases of fixed number of firms upstream and free-entry upstream are analyzed. • Particular emphasis is given on the role of the economies of scope in the product creation process. • The effect of various market features (i.e. number of retailers, size of the market) on equilibrium market outcomes (i.e. wholesale prices, product variety, number of manufacturers etc.) and on welfare is investigated.