Download
1 / 45
450 likes | 452 Views
This analysis examines the evolution of convection initiation cases during the International H2O Project (IHOP). It includes surface analysis, data collection, and the factors contributing to the initiation or lack thereof of deep convection.

E N D
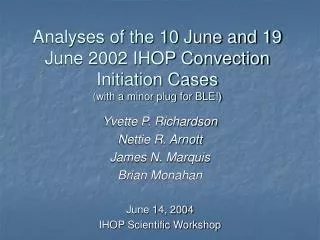
Analyses of the 10 June and 19 June 2002 IHOP Convection Initiation Cases(with a minor plug for BLE!) Yvette P. Richardson Nettie R. Arnott James N. Marquis Brian Monahan June 14, 2004 IHOP Scientific Workshop
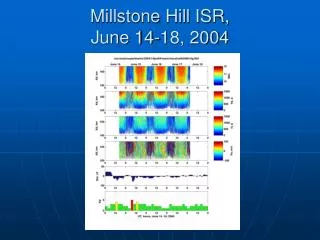
10 June 2002 IOR Data Collection: 1918 UTC – 2118 UTC CI: 2103 UTC
Sounding in IOR 2044 UTC Weak capping inversion Dry air above boundary layer LCL 3 km AGL Top of domain
Sounding near CI 1935 UTC LCL 3 km AGL
King Air W vs. Radar W King Air track = black line Warm colors = +w Cold colors = -w 740 m AGL Correlation = 0.78 1230 m AGL Correlation = 0.83 A A’ A A’
23.0km 100 m AGL Warm colors = convergence Cold colors = Divergence Contoured every 2 x 10 –3 s-1 (0 contour not shown) 23. 5 km
23.0km 100 m AGL Warm colors = convergence Cold colors = Divergence Contoured every 2 x 10 –3 s-1 (0 contour not shown) 23. 5 km
23.0km 100 m AGL Warm colors = convergence Cold colors = Divergence Contoured every 2 x 10 –3 s-1 (0 contour not shown) 23. 5 km
23.0km 100 m AGL Warm colors = convergence Cold colors = Divergence Contoured every 2 x 10 –3 s-1 (0 contour not shown) 23. 5 km
Parcel trajectory movies Parcels reach 100 m AGL at 1953 UTC Parcels reach 100 m AGL at 2017 UTC Box =IOR Height = 1.4 km View Point: Ahead of the cold front looking towards the North West
1955 UTC 1946 UTC
2007 UTC 2010 UTC
IOR convergence beings weakening 2020 UTC
IOR convergence beings weakening 2025 UTC
IOR convergence beings weakening 2034 UTC
IOR convergence beings weakening 2039 UTC
IOR convergence beings weakening 2045 UTC 2037 UTC
IOR convergence beings weakening 2055 UTC
Why was there no initiation of deep convection within the IOR?
Potential Temperature at 600 m AGL Behind cold front Ahead of cold front P3 Track 1956 UTC 1939 UTC 2018 UTC 2035 UTC
Convection did not initiate in IOR because… • Weakening temperature gradient across cold front led to weaker frontal circulation • Dry air aloft made growth difficult to sustain 2007 UTC 2056 UTC Weakening convergence
Enhanced convergence? Cold front did not dissipate? Boundary – cold front intersection? Hints of this in satellite and radar data Did wave pattern along front have any influence? Why did convection initiate so close by?
Future Work • ELDORA data near CI (with Kingsmill) • Photogrammetry to map clouds • Submit paper for Special Issue • Data assimilation / Numerical modeling • Fill in data gaps • Influence of nearby developing convection • Influence of warming and convective instability
June 19 CI Case • Dryline near Colby, KS
DOW2 DOW2 XPOL IOR #1 IOR #2 XPOL DOW3
DOW2 DOW2 XPOL DOW3
Deployment #2 – 21:20+ UTC 25 14 13.5
Deployment B Loop 1 • Deployment B Loop 2
Z=400m Vorticity in Color White contours of w wmax Strong misocyclones – separated from w by approximately ¼ wavelength
Z=400m Vorticity in Color White contours of w Misocyclones similar intensity to previous time Updraft filling in along line
Initiation of Deep Convection Cells apparent at 21:23 in DOW3 scans Initiation captured by XPOL but occurs ‘behind’ DOW3 while DOW2 is in motion Unclear if origin can be traced to features within the IOR Aircraft may be needed to fill in the gaps DZ DOW3 21:23
Later Initiation • Deployment 2 Loop 3
6 pm CDT Landspout 4pm CDT Dustdevil
Future Work • Combine wind analyses with water vapor measurements (lidar, mobile mesonets, dropsondes, satellite, MIPS, mobile radiometer, etc.) • Perform trajectory calculations to look at initiation and misocyclone formation/evolution • Cloud Photogrammetry Analysis (with Erik Rasmussen) • Submit Paper for Special Issue
Boundary Layer Evolution(14 June 2002) • Fine Resolution Radar Loop from 1300-1900 UTC


![[ r ] = dEG n /2 p,](https://cdn5.slideserve.com/9509013/in-summary-dt.jpg)