Download
1 / 16
160 likes | 264 Views
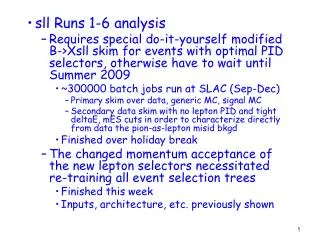
Analysis of A- F special runs. S.Doulas, Shashi Dugad, Mike Eades, Anatoli Efremov, Al Ito, B.Satyanarayana. Introduction. Special runs were taken in order to obtain qADC and TDC distributions for each channel with sufficient statistics

E N D
Analysis of A-F special runs S.Doulas, Shashi Dugad, Mike Eades, Anatoli Efremov, Al Ito, B.Satyanarayana
Introduction • Special runs were taken in order to obtain qADC and TDC distributions for each channel with sufficient statistics • qADC distributions are meant to be used to compute invidual thresholds using q to V conversion factors (Presented by S.Dugad in an earlier Muon Meeting)
A-F geometry • Consists of nine F rings; 70 channels per ring • Side and top octants (Octs. 0~4, 7) has full coverage of the F rings while the bottom octants (Octs. 5 & 6) have 50% coverage • 10 scintillators/ring/oct for the top and the side and 5 for the bottom octants
Data taking • Special runs were taken by Anatoli, Steve & Al during Aug-Dec, 2002 • Modified version of SCINTEXAMINE (Mike Eades and Steve) is used to covert the raw data into rootuples containing scintillator hits for each event • Data processed by Anatoli, Steve and Al.
Analysis • ROOT-based utility was developed to analyse the data in rootuples • QADC and TDC distribution data for individual channels studied • Muon energy loss in scintillators is h dependent • Data is clubed as per F rings
Analysis (Contd.) F Ring channel number convention
F Ring-wise TDC entries Total entries obtained by counting hits within -3*tdcrms < tdc < 3*tdcrms Side boundaries marked
TDC peak distrubutions • TDC peaks are expected to be around 0 • For most of the channels the peak values lie within G3ns • Some channels show large deviations
List of bad TDC channels Note: Peaks set to -100 when TDC distrubutions couldn't be fit.
Ring-wise hit distribution • Valid TDC hist counted for all channels in each phi ring • Outer rings show large hits • Backscattered tracks? • No well separated peaks seen for backscattered particles
F Ring-wise ADC plots Histograms filled with ADC hits having intime TDC (-3*tdcrms < tdc < 3*tdcrms)
h dependence of ADC peaks • Energy loss in scintillator increases with h. • ADC distribution plotted as per F ring.
ADC peaks within a ring • Within a ring, ADC peaks are expected to be same. • For F = 0 ADC data was clubbed for all channel of an octant • ADC peaks show consistenancy within G15%
Summary and future plans • h dependence of energy loss seen from the data • 9 channels showed bad TDC distribution • Large number of hits in outer rings; needs to be understood • Pedestals to be obtained using calib runs • Pedestal subtracted ADC distributions to be obtained per ring per octant (clubbing 10 channels) • q to V conversion to be applied on these to derive discriminator thresholds