Download
1 / 52
540 likes | 751 Views
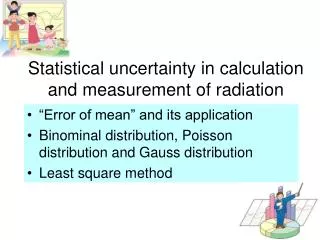
Statistical uncertainty in calculation and measurement of radiation. “Error of mean” and its application Binominal distribution, Poisson distribution and Gauss distribution Least square method. 1.1 Variance and standard deviation Repeat measurement or calculate a quantity x by n times .

E N D
Statistical uncertainty in calculation and measurement of radiation • “Error of mean” and its application • Binominal distribution, Poisson distribution and Gauss distribution • Least square method
1.1 Variance and standard deviation Repeat measurement or calculate a quantity x by n times. Write value of i-th x as xi . The mean is cm, cGy (Example of unit) Variance s2: A quantity to express fluctuation of each x. Mean of square of difference between individual x and mean , cm2, cGy2 Standard deviation s: Square root of variance. Useful to express fluctuation of x because s and x are same dimension. cm, cGy
Practice of mean and variance • Assume 5 carrots of 6, 7, 8, 9, 10 cm length. • What is a mean of carrot length? • 8 cm • What is a variance of carrot length? • 2 • What is a standard deviation of carrot length? • 1.41 cm
Instinctive explanation of error of sum and error of mean • Measure 100 cpm by 1 min100±10 • N=100 x 1 min =100, σ=1001/2=10 • 100 cpm by 1 min, repeat 4 times400±20 • N=100 cpm x 1 min x 4 =400, • σ=4001/2 = 20 • This ”20” can also be obtained by 10 x 41/2. Error of sum of xi(sy)is Error of xitimes n1/2. • Go back to “per min” by dividing by 4,100±5 • This ”5” can also be obtained by 10/41/2. Error of average of xi(sx_bar) is Error of xitimes1/n1/2.
Practice of error of sum and mean • Assume 5 carrots of 6, 7, 8, 9, 10 cm length. • What is a total length of carrot? • 40 cm • What is a error of total length of carrots? • 3.16 cm • What is a mean length of carrots? • 8 cm • What is an error of mean length of carrots? • 0.63 cm
1.2 Error of sum (y) The variance of y is obtained from standard deviation of xi, Δxi (Propagation of error) Here, variance of y sy2is written as Δy2 . Standard deviation of y, syis square root of sy2 . The error of n - xi,sy ,is “error of xi“ timesn1/2 .
1.3 Error of average of xi, xav The variance of xavis obtained from standard deviation of xi, Δxi. (Propagation of error) Here, variance of xav, sxav2 asΔxav2. Standard deviation of xav , sxav is square root of sxav2 . Error of average of n-xi , sx_bar, is error of xitimes1/n1/2.
Central limit theorem • Assume any distribution of average μ and variance σ2. Sample is taken from that distribution by n times. The distribution of average of the sample xav converges to normal distribution N(μ, σ2/n) when n is large. Basic statistics by K.Miyagawa (in Japanese) • Mathematical confirmation of Monte Carlo method
Fig.4 Error of sum, y, sy Fig. 3 Standard deviation of x
Numerical evaluation of variance s2 • Excel RAND() function:(0,1) random • Average of 10 random numbers and variance s2 • Repeat 100 set to get average of s2 . • Change number of random n=9 ~ n=1 and repeat.
Result of s2 from excel calculation Certainly, s2depends on n !
A variance independent of sample number n, s2 • Average of square of difference of each value and expected value of average μ(=0.5). • Numerical calculation by Excel • Calculate variance of 10 random numbers s2. • Repeat 100 sets to get average of s2. • Change n=9 ~ n=1 and repeat. s2 ↓
Result of s2by Excel calculation s2 is independent of n ! We can not use s2as m is unknown in general. → We are in trouble !!
For now, what is an expected value of s2 ? Then, how about s2 ? E(s2)=E(s2) x (n-1)/n
Variance which is independent of sample number n(2) We change 1/n to 1/(n-1) in the equation s2to get variance which is independent of sample number n. This is called as sampling variance or unbiased variance in some textbook. Fig.1 Comparison of variance
Variance against μ Variance OF xav Variance against xav + = Proof of unbiased variance We rewrite formula of variance in which expected value of average, μ, is included. Rewrite this as a relation of expectation value. (3rd term in right-hand-side is 0)
Summary of Chapter 1 “Error of average” Variance which is independent of sample number (*) Definition of variance Equivalent of estimate error of N±N1/2(*) Variance of average *Derived from error of average
tdistribution • Variable in central limit theorem is rewritten. • The distribution of converges to standard normal distribution N(0,1) when n is large. • If σ is known, the interval of μ can be estimated by z. • If σ is unknown, its estimated value is used,
Shape of t distribution Normal distribution (=t distribution with d.f.=∞) t distribution with degree of freedom=20 t distribution with degree of freedom=2 t distribution with degree of freedom=5 From Miyagawa, “Elementary statitics”
The nature of t distribution 1. The shape of t distribution is symmetric in left and right with 0 as its centroid. Thus, its mean is 0. 2. The shape of t distribution resembles to that of standard normal distribution. But t distribution has lower at its top and wider in the side. (t distribution converges to normal distribution as n→∞) - The reason of fluctuation in Z is only x bar. On the other hand, fluctuation of sigma hat also contributes to fluctuation of t. 3. The shape of t distribution depends on n only and does not depend on any unknown parameter of population. → Numerical table of t distribution was published.
Coffee Break Student’s t distribution (from wikipedia) • Gossetattended Winchester College before reading chemistry and mathematics at New College, Oxford. Upon graduating in 1899, he joined the brewery of Arthur Guinness & Son in Dublin, Ireland. • As an employee of Guinness, a progressive agro-chemical business, Gosset applied his statistical knowledge — both in the brewery and on the farm — to the selection of the best yielding varieties of barley. Gosset acquired that knowledge by study, by trial and error, and by spending two terms in 1906 – 07 in the biometrical laboratory of Karl Pearson. Gosset and Pearson had a good relationship. Pearson helped Gosset with the mathematics of his papers, including the 1908 papers, but had little appreciation of their importance. The papers addressed the brewer's concern with small samples; biometricians like Pearson, on the other hand, typically had hundreds of observations and saw no urgency in developing small-sample methods. • Another researcher at Guinness had previously published a paper containing trade secrets of the Guinness brewery. To prevent further disclosure of confidential information, Guinness prohibited its employees from publishing any papers regardless of the contained information. However, after pleading with the brewery and explaining that his mathematical and philosophical conclusions were of no possible practical use to competing brewers, he was allowed to publish them, but under a pseudonym ("Student"), to avoid difficulties with the rest of the staff.[1] Thus his most noteworthy achievement is now called Student's, rather than Gosset's, t-distribution. 13Jun1876-16Oct1937
Appendix B.1 Writing of “Error of average” ・Elementary Statistics:Standard error of mean ・Measurement and detection of radiation (Tsoulfanidis): Standard error of mean value ・Radiation detection & measurement (Knoll):No description ・Nuclear Radiation Detection (Price):No description ・Homepage of statistics bureau:Standard error ・Wikipedia : Standard error ・Kaleidagraph:Standard error How words can be omitted for “Standard error of sample mean”
Section 2Binomial, Poisson, and Gaussian distribution • Outline of distribution • Sum, Mean, and Variance • Relation of distributions
Generation of Binomial distribution by experiment • Prepare ten samples which have 2 states with same probability. For example, prepare 10 coins and put mark (i.e. removable seal) on one side. • Take several of these and align on the table to count number of samples with mark (call it as p. Also call number of sample without mark as q) • For n=1, p is either 1 or 0. • For n=2, the number of combination is 4 i.e. pp, pq, qp, qq . The combination for p=2,1,0 is 1,2,1. • For n=3, the number of combination is 8, i.e. ppp, ppq, pqp, pqq, qpp, qpq, qqp, qqq . The combination for p=3,2,1,0 is 1,3,3,1 respectively. • Investigate this up to n=8 (or n=10 if possible).
Generation of Binomial distribution by experiment (2) • Throw samples on the table 10 times and count number of sample with mark. • Start from n=1 and continue up to n=10. • Compare the distribution with that obtained in the previous page. • Align experiment is a kind of round-robin. On the other hand throwing is sampling. • Any combination in align method should appear in sampling with same probability. Then, both distribution should agree within a statistical fluctuation.
Calculate Eq.(17) for p=0.5, n=1 to10. Compare it with binomial distribution by experiment.
Binomial distribution converges to Poisson distribution as hit probability decreases Fig. 8 Comparison of binomial and Poisson distribution
Fig.9 Approximation of binomial and Poisson distribution by Gaussian distribution
Section 3 Least Square Method Concept of Least Square Method: Determine a and b to minimize d12+d22+d32 (Fig.10)