Download
1 / 36
460 likes | 915 Views
Uncertainty and Error in Measurement (IB text - Ch 11) (If reviewing this slide in the senior year, there is also uncertainty information in the AP text - section 1.4 pgs. 10-13 and A10-A13).

E N D
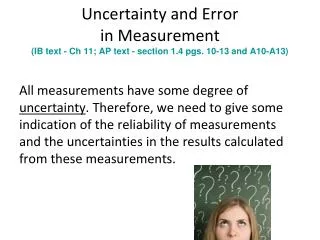
Uncertainty and Error in Measurement(IB text - Ch 11) (If reviewing this slide in the senior year, there is also uncertainty information in the AP text - section 1.4 pgs. 10-13 and A10-A13) All measurements have some degree of uncertainty. Therefore, we need to give some indication of the reliability of measurements and the uncertainties in the results calculated from these measurements.
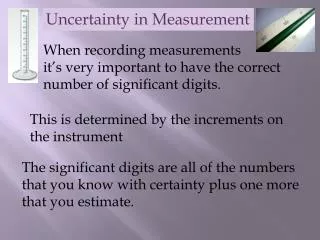
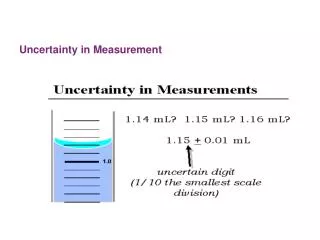
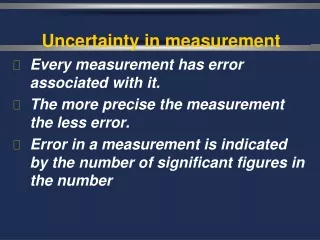
Uncertainty in Measurement We customarily report a measurement by recording all the certain digits plus the first uncertain digit. Collectively, these are known as “significant figures”
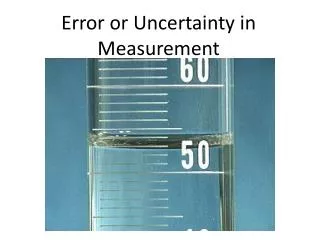
We can determine without question that the value is between 22 and 23 ml. We then estimate the next digit as 2. So the measurement should be reported as 22.2 ml.
9 6 5.
Precision in measuring • The total number of digits and the number of decimal points tell you how precise a tool was used to make the measurement. • Which is a more precise tool for measuring small volumes, a graduated cylinder with mL markings or a pipette with 10 marks per mL? • Why? • What are the advantages of each?
Comparing Equipment The pipette is a more precise tool than the graduated cylinder because it has clear markings every tenth of a mL (i.e. 9.01 mL ( 0.05 mL)), while the graduated cylinder only has markings every mL (i.e. 9.0 mL ( 0.5 mL)). Notice that the magnitude of the uncertainty should be in agreement with the precision of the measurement as written.
Precision: • degree of agreement among several measurements of the same quantity. • reflects the reproducibility of a measurement. (Precision does not imply accuracy)
Accuracy • The extent to which your measurement is in fact close to the true, or accepted value. If you do not know the true value, it may be difficult to determine accuracy.
Accuracy & Precision Neither accurate nor precise Precise, not accurate Accurate and precise Accurate, not precise
Errors in Measurement There are 2 different types of errors illustrated in the figures below: Random errors and systematic errors Neither accurate nor precise Precise, not accurate Accurate and precise Accurate, not precise
Random Errors (also called indeterminate errors pg. 12 of Zumdahl) • Every time you make a measurement you measure a slightly different quantity each time, as a result of making measurement on imperfect tools. The tendency of a measured value to “jump around” from measurement to measurement is the statistical error. • Random errors have an equal probability of being high or low as compared to the true value. It occurs in estimating the value of the last digit of a measurement.
Random Errors (also called indeterminate errors pg. 12 of Zumdahl) • Thus, the uncertainties of the measurement tools used result from random error. • Random errors are caused by: • The readability of the measuring instrument • The effects of fluctuating changes in the surroundings (e.g. temperature variations and air currents) • Insufficient data • The observer misinterpreting the reading • Random errors can be reduced through repeated measurements (i.e. increasing number of trials decreases effects of random error)
Large random errors (#s jump around) Neither accurate nor precise Precise, not accurate Small Random Errors Accurate and precise Accurate, not precise
How to calculate random errors This is very important!!! • For analog measurements, random errors can be estimated to be half of the smallest division on the scale • For a digital reading such as an electronic balance, random error of ± smallest division • i.e. electronic balance that reads to the hundredths place could lead to a value of 3.01 g (± 0.01 g)
Systematic Errors (determinate errors pg. 12, Zumdahl) • This is the uncertainty and error in measurement caused by anything that is not statistical error. • These are procedural errors that generally have to do with instrumental effects, not taking things into account, or just doing stupid things. • Systematic errors are always either high or low, not both (occur in the same direction each time).
Large Systematic Errors (too high from true value) Neither accurate nor precise Precise, not accurate No Systematic Errors Accurate and precise Accurate, not precise
Examples of Systematic Errors • Leaking gas syringes • Calibration errors in pH meters • Calibration of a balance • Liquids evaporating • Changes in external influences such as temperature and atmospheric pressure affect the measurement of gas volume, etc. • etc…
Reporting Measurements • There are 3 parts to a measurement: • The measurement • The unit • The uncertainty (estimated magnitude of random error w/ unit) • The absolute uncertainty is the size of the range of values in which the "true value" of the measurement probably lies.
Example: The unit The uncertainty also needs a unit(could be same unit as quantity or %) 5.2 cm An uncertainty of 0.5 cm for this measurement means you are reasonably sure the actual length is somewhere between 4.7 cm and 5.7 cm. ± 0.5 cm The uncertainty The measurement
Practice 0 5 10 15 20 25 30 35 cm What is the length of the blue bar?
31.0 cm 0 5 10 15 20 25 30 35 cm We know for sure that the measurement is 31 cm, and therefore we estimate the last digit to be .0 The measurement of 31.0 cm has the measurement and the unit, but it’s missing the 3rd part (THE UNCERTAINTY)
The Uncertainty…31.0 cm (± 0.5 cm) 0 5 10 15 20 25 30 35 cm The bar appears to line up with the 31st mark and you know it’s more than ½ way from the 30 mark and less than ½ way from the 32nd mark. So, you can reasonably be sure the actual length of the bar is between 30.5 and 31.5 cm… Remember!!! The uncertainty (measure of random error) is half of the smallest division (hash marks) on an analog scale. The division on the scale goes to the ones spot, so ½ of the ones spot is 0.5
3 2 1 More Practice What is the correct measurement of the liquid in this container? mL
3 2 1 REMEMBER!!! • Do you have the 3 requirements for reporting a measurement? • The measurement • The unit • The uncertainty mL
3 2 1 More Practice We know for sure it is 2.7 mL We estimate the last digit to be 2.75 mL mL
3 2 1 More Practice What’s the uncertainty? The uncertainty (measure of random error) is half of the smallest division (hash marks) on a scale. The smallest division is in the tenths spot (2.7 mL). Therefore, ½ of 0.1 = 0.05 as the uncertainty. mL
3 2 1 More Practice 2.75 mL (± 0.05 mL) mL
Dealing with uncertainties • Now you know the kinds of errors (random and systematic) that can occur with measurements and you should also have a very good idea of how to estimate the magnitude of the random error that occurs when making measurements (the uncertainty).
What do we do with the uncertainties when we add or subtract two measurements? Or divide / multiply two measurements? • REMEMBER SIG FIG RULES??!!!???
Significant Figures 1. Non zero integers always count as significant. 2 sig figs .0025 2. Leading zeros never count. 5 sig figs 90036 3. Captive zeros always count. 2 sig figs 120 4. Trailing zeros are significant only if the number contains a decimal point. 3 sig figs 120. 4 sig figs .002000
Significant Figures: Rules Any number based on calculations and measurements must have the same number of significant figures as the least precise measurement that went into it. This is a big deal! Get it right!
Significant Figures in Calcs. • Multiplication and Division: • Answer has the same number of significant figures as the least precise measurement. 2.00 x 15 = 30. 2.015 1.2 + 31.1231 • 2. Addition and Subtraction: • Answer has the same number of decimal places • as the least precise measurement. 34.3
When you mathematically manipulate a measurement you must take into consideration the precision. • If you add two measurements, the result CANNOT BE MORE PRECISE!
Just because your calculator has all the numbers listed, doesn’t mean you should report them in your answer. You must pay attention to significant figures!
For example: • Mass of empty container = 2.3 g • Mass of copper = 20.24 g • What is the mass of the container with the copper in it? 2.3 g + 20.24 g = 22.5 g NOT 22.54 g
WHY 22.5g ??? • Since the mass of the empty container is recorded to the tenths spot, it limits the answer to only the tenths spot (because the tenths spot is less precise than the hundreths spot of the copper mass measurement) Mass of empty container = 2.3 g Mass of copper = 20.24 g • Perhaps the actual value of the empty container is 2.2 g or 2.4 g based on a random error, then the mass of the container could turn out to be 22.44 g or 22.64 g. As you can see the difference in the tenths place is far more significant than the hundredths place. So, the mass should be reported to 22.5 g