Domain and Range: Graph
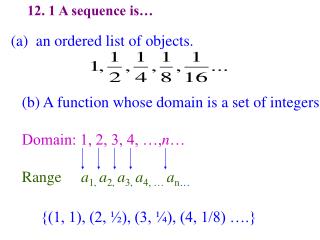
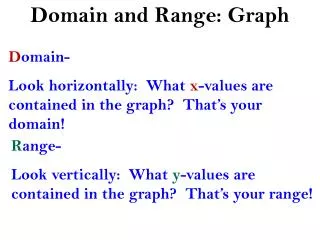
Domain and Range: Graph. D omain- Look horizontally: What x -values are contained in the graph? That’s your domain!. R ange- Look vertically: What y -values are contained in the graph? That’s your range!. Domain and Range: Graph. Domain: [-3,2]. Range: [-5, 2].

Domain and Range: Graph
E N D
Presentation Transcript
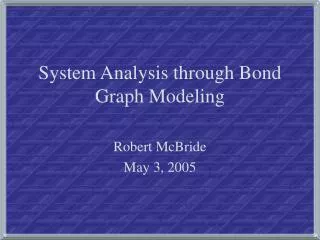
Domain and Range: Graph Domain- Look horizontally: What x-values are contained in the graph? That’s your domain! Range- Look vertically: What y-values are contained in the graph? That’s your range!
Domain: [-3,2] Range: [-5, 2]
Domain: [-3,3) Range: (-1, 2]
Maximum and Minimum Maximum value: the highest y value seen in the data or on the graph. Minimum value: the lowest y value seen in the data or on the graph.
Max: 2 Min: -5
Increasing and Decreasing: Graph To find where the graph is increasing and decreasing trace the graph with your finger from left to right. Specify x-values! If your finger is going up, the graph is increasing. If your finger is going down, the graph is decreasing.
Inc: (-3,-2.1); (.9,2.1) Dec: (-2.1,.9)
End Behavior: Graph The value a function, f(x), approaches when x is extremely large (∞) (to the right) or when x is extremely small (-∞) (to the left).
Points of Discontinuity • These are the points where the function either “jumps” up or down or where the function has a “hole”. • For example, in a previous example Has a point of discontinuity at x=1 The step function also has points of discontinuity at x=1, x=2 and x=3.
Maxima and Minima(aka extrema) Lowest point on the graph Highest point on the graph In this function, the minimum is at y = 1 In this function, the minimum is at y = -2
Axis of Symmetry This ‘axis of symmetry’ can be found by identifying the x-coordinate of the vertex (h,k), so the equation for the axis of symmetry would be x = h. • The vertical line that splits the equation in half. For the equation the axis of symmetry is located at x = 1
Intervals of Increase and Decrease • By looking at the graph of a piecewise function, we can also see where its slope is increasing (uphill), where its slope is decreasing (downhill) and where it is constant (straight line). We use the domain to define the ‘interval’. This function is decreasing on the interval x < -2, is Increasing on the interval -2 < x < 1, and constant over x > 1