Download
1 / 26
370 likes | 675 Views
Root Cause Analysis. Seven Common Traits Observed in Successful Schools. • Strong Leadership • Positive Belief and Teacher Dedication • Data Utilization and Analysis • EffectiveScheduling • Professional Development • ScientificallyBased Intervention Programs • Parent Involvement.

E N D
Seven Common Traits Observed in Successful Schools • Strong Leadership • Positive Belief and Teacher Dedication • Data Utilization and Analysis • EffectiveScheduling • Professional Development • ScientificallyBased Intervention Programs • Parent Involvement
Assessments • Assessments are designed to determine the student's abilities and needs in relevant aspects of the curriculum and instruction. • Educators need this essential tool to guide day-to-day instruction.
Range of Assessments • The range of assessments may range from classroom assessment practices all the way to district and statewide assessment programs.
The Four Types of Reading Assessments • Screening Assessment: (First Alert) These quick, easily administered assessments are used to identify those students who are at-risk for reading difficulties. (Dibels, AimsWeb) • Progress Monitoring Assessments: These assessments are used to ensure that students are making adequate reading progress. They must be easily administered and sensitive to growth over short instructional intervals. These assessments quickly determine the need for instructional change when progress is not at the expected level. (Dibels, AimsWeb, 4Sight) • Diagnostic Assessments: These in-depth assessments determine a student's specific instructional needs and what and how much intervention may be required. They measure the component skills of reading, and determine where in the scope and sequence of those skills the student falls. (Woodcock Reading Mastery Test, Peabody Picture Vocabulary Test) • Outcome Assessments: These assessments are used to determine whether students have achieved grade-level or proficiency standard performance. (PSSA)
Data Process • Collect and chart data • Analyze strengths and obstacles • Establish goals: set, review, revise • Select instructional strategies • Determine results indicators
4 Kinds of Data • Demographic Data • Student Learning Data • Perceptions Data • School Processes Data
Student Learning Data • Standardized test scores • Grade point averages • Standards assessments • Authentic assessments
The Data Pyramid Annually 2-4 times a year Quarterly or end of unit 1-4 times a month Daily/ Weekly
Formative Classroom Assessments • Teachers must spend most of their time using this form of assessment • Information is used to: • adjust teaching • provide feedback to students to help them improve their learning • Examples: descriptive feedback to students, use of rubrics with students, multiple methods of checking for understanding, examination of student work, and tests and quizzes
Formative Common Assessments • Frequently analyzed by the data team • Importance: • Identifying student-learning problems • Generate short cycles of improvement • Frequently monitor progress toward the overall student-learning goal
Benchmark Common Assessments • Administered at the end of a unit or quarter • Importance: • Assesses the student’s mastery of concepts and skills recently taught • Excellent sources of student-learning data because they are timely, closely aligned with local curriculum and has item level analysis • Can be used to immediately improve instruction • Can be used to provide data for programmatic changes.
Demographic data • Data about people, practices, and perceptions • Examples: • Student populations • Teacher characteristics data • Course enrollment data • Dropout rates
Summative Assessment Data • Includes state assessments and annual district tests • Data is used to: • Determine accountability • Identify a student-learning problem • Set annual improvement targets
PSSA Testing Calendar 08-09 • October 20 – 31, 2008 12th Grade Retest for Math, Reading & Writing • February 9 – 20, 2009 5th, 8th& 11th Grade Writing Assessment • March 16 – 27, 2009 3rd, 4th, 5th, 6th, 7th, 8th& 11th Grade Math and Reading Assessment • April 27 - May 8, 2009 4th, 8th& 11th Grade Science Assessment
“Drilling Down” • The process of looking more and more deeply at data to gather more information. • Love 2008
What is “Root Cause” • The deepest underlying cause, or causes of positive or negative symptoms within any process, which if dissolved, would result in elimination or substantial reduction of the symptom. Pruess 2007
Why Root Cause Analysis • Helps dissolve the problem • Eliminates patching and wasted effort • Conserves scarce resources • Induces discussion and reflection • Provides rationale for strategy selection
When is a Cause a Root Cause? • 1. Would the problem have occurred if the cause had not been present? • No, then it is a root cause. • Yes, then it is a contributing cause.
Root Cause • 2. Will the problem reoccur as the result of the same cause if the cause is corrected or dissolved? • No, then it is a root cause • Yes, then it is a contributing cause
Root Cause • 3. Will correction or dissolution of the cause lead to similar events? • No, then it is a root cause • Yes, then it is a contributing cause
Other Indicators • You run into a dead end • Everyone agrees that it is the root cause • The cause is logical, makes sense, and provides clarity to the problem • The cause is something that you can influence and control Pruess 2003
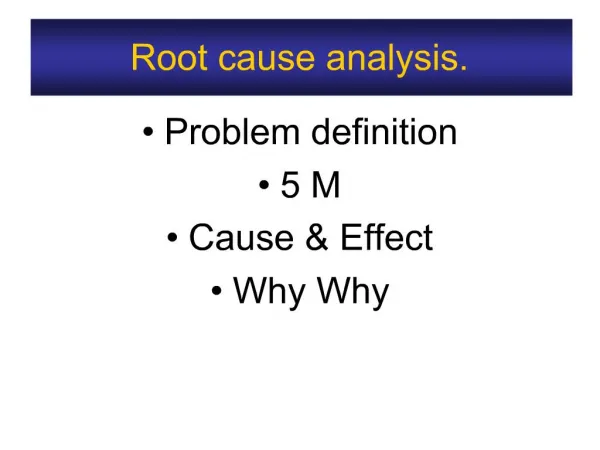
RCA Tools • 1. The Questioning Data Process • 2. The Diagnostic Tree Process • 3. The Creative Root Cause Analysis Team Process • 4. The Five Whys • 5. Force Field Analysis • 6. Barrier Analysis • 7. Fishbone Diagram
Contexts for RCA • RCA can be used at any level within a school district or building • A teacher working to improve classroom instruction • A grade level or department seeking to improve learning • School Improvement • A council working to remove barriers to student success at the district level
Sources • Love, Nancy; Stiles, Katherine; Mundry, Susan; DiRanna, Kathryn (2007).The Data Coach’s Guide to Improving Learning for All Students. Thousand Oaks, CA: Corwin Press. • Pruess, Paul G. (2003) School Leaders Guide to Root Cause Analysis Using Data To Dissolve Problems. Larchmont, NY 10538. Eye on Education. • Pruess, Paul G. (2007) Data-Driven Decision Making and Dynamic Planning. Larchmont, NY 10538. Eye on Education. • Reeves, Douglas B. (2008) Data for Learning. Englewood, Colorado: The Leadership and Learning Center.