Download
1 / 32
320 likes | 347 Views
X-ray Observations of Stars. Rachel Osten University of Maryland, NASA/GSFC. (The highest spatial resolution X-ray observation of a star!). Outline . X-ray HR diagram The 3 R’s Hot stars: science topics Cool stars: science topics. X-ray HR diagram. after G ü del 2003.

E N D
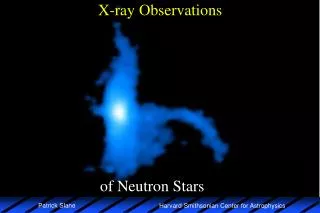
X-ray Observations of Stars Rachel Osten University of Maryland, NASA/GSFC (The highest spatial resolution X-ray observation of a star!)
Outline • X-ray HR diagram • The 3 R’s • Hot stars: science topics • Cool stars: science topics
X-ray HR diagram after Güdel 2003
Resolution, resolution, resolution Spectral Spatial Time
Resolution, resolution, resolution ACIS image of Gl569, resolving the brown dwarf binary (Bab) from the M star primary Spectral Spatial Time Stelzer et al. 2005
Resolution, resolution, resolution First light spectrum of Capella with Chandra/HETGS Spectral Spatial Time
Resolution, resolution, resolution Chandra/HETGS light curve of flaring activity in the M dwarf EV Lac (Osten et al. 2005) Spectral Spatial Time
Massive Stars (>10Msun) & X-ray Emission • Radiative envelopes, no convection to surface (unlike solar-type stars) • Hence, no dynamo generation of magnetic activity => no X-ray emission? • Actually, no. . .
X-ray Spectrum of Zeta Ori(Cassinelli 2000) Outflowing stellar winds convert a portion of their energy into X-ray emission through shocks
Wind Structure • Lines are broader than spectral resolution, blueshifted • Modelling line profiles gives understanding of wind structure & dynamics: clumpy? Mass-loss too high? • Find hidden binaries via wind-wind collisions • X-ray emission can have significant influence on CS environment of young stars through photoionization O supergiant Zeta Puppis; Kramer et al. 2003
B stars possess neither strong stellar winds nor significant surface magnetic fields, so should not be able to produce X-ray emission Stelzer et al. 2003 Companion hypothesis works for a fraction of these objects. . .does it work for all of them?
Cool stars: big issues • Ultimate source of stellar coronal heating unknown; related to dynamo generation of magnetic fields • Study manifestations of magnetic activity in stars w/different parameters (age, surface temperature, rotation, magnetic field topologies), determine how coronal heating observables change • Compare with our closest star, the Sun
Spatially identifying source of X-ray emission Hybrid giants & source of X-ray emission g Dra Ayres et al. (2006): g Dra, a windy hybrid coronal giant, has an X-ray brighter companion 21” away (explaining some of the ROSAT flux), but has a feeble corona itself
Orion Nebula: Orion Molecular Core 1 McCaughrean 2005 COUP; Feigelson et al. 2005
Orion Nebula: Orion Molecular Core 1 X-ray observations allow detection of young stars through large amounts of visual extinction (500 mags to star indicated in blue!) Characteristics of coronal plasma in young stars: how to get from there (t~1 MY) to the Sun (5GY), effect on stellar environment
Spectral parameters: Tcor, NH VEM Related quantities: L=size of coronal loops
Equation for plasma in coronal equilibrium (flux of one line): j-th level of the m-th ionization state of element X Differential Emission Measure Nj=pop’n of j-th level of ion, Aji=spont. emission prob. from level j to level i Re-write nj as product of ratios Abundance Level pop’n Ion. fraction =0.83 in fully ionized plasma Rewrite as With AX = abundance, Pl(T) =“contribution function” or “emissivity” (but check definition; it can vary)
Differential Emission Measure So, with the previous equation and a new definition, we get Where f(T) is the emission measure differential in temperature, or differential emission measure (DEM), basically, the amount of plasma at a given temperature. Why is this important? The shape of the DEM can be used to infer coronal structure and test (some) coronal heating models. Note that this is a volume emission measure; some spectroscopists (notably solar coronal types) use a column emission measure. Also note that the definition of the DEM can be slightly different as well (dlogT or dT, ne2dV or nenH dV)
DEM of active stars Sanz-Forcada et al. (2003) a Cen, like Sun, has peak in coronal DEM at ~ few MK More active stars have peaks at higher temps. Huenemoerder et al. (2001) Flare and quiescent states of the active binary II Peg
Spectral diagnostics:Abundances For elements with similar Tform, changing line ratios indicate changing abundances Full DEM modelling of lines and continuum is needed get [X/H] Continuum mostly H, He free-free, but signif. contributions from elemental free-bound, e.g. Oxygen Audard & Güdel 2002
Spectral diagnostics: Abundances Changes during flare indicate creation of hot plasma, increase of abundances => photospheric abundance material being dredged into corona s2CrB (F9V+G0V): Osten et al. 2003
Interrelation of thermal / nonthermal processes constrains underlying heating, dynamics, energetics Basic Flare Scenario Neupert Effect = Observational temporal relationship between (incoherent) signatures of accelerated particles and plasma heating SXR(t)=t0t HXR (t’)dt’ or MW(t’)
Multi-wavelength flare correlations: Neupert effect HR 1099; Osten et al. 2004 mwave gyrosynchrotron emission occurs outside of flares on active stars as well, requires continuous particle acceleration to sustain emissions UV Cet (dM5.5); Güdel et al. 1996
Dynamic,magnetically heated plasma s2CrB: Osten et al. 2000 Want to determine not only plasma parameters, but their changes during flare episodes, or as f’n of some other relevant timescale (Prot, Porb)
Electron density • Issues for (cool) stars: • Te • Line blending • Radiation field? • Isobaric corona? • Changes with activity state? MEG HEG Ne IX
Combining density, emission measure s2CrB; Osten et al. 2003
Other diagnostics : nonthermal emission 1st detection of NT Hard X-ray emission in a stellar flare! Superflare on II Peg; Osten et al. 2007
Other diagnostics: Fe Ka 6.4 keV 6.4 keV “cold” iron (Fe I—XVI) can be formed by high E (>7 keV) continuum emission “shining” on stellar photosphere, illuminating a disk, or possibly also by the action of accelerated electrons Superflare on II Peg; Osten et al. 2007
Other diagnostics: velocity shifts X-ray emission follows the more massive star in the binary VW Cep; Huenemoerder et al. 2003
CCD vs grating spectral resolution Gratings allow one to see the trees, not just the forest, of coronal emission lines However, there are many more CCD resolution spectra in the Chandra & XMM-Newton archives than grating spectra, due to efficiency considerations, so need to understand the biases introduced
Future. . . Longer grating observations of bright stars, or long grating observations of X-ray fainter stars, with current facilities Need more detailed observations in order to get a better grasp of the physics, not just phenomenology: higher spectral resolution (“thermal limit spectroscopy”) more collecting area, to observe more than just “the usual suspects” with high spectral resolution coordinated multi-wavelength observations to extract the most information possible out of the obs’ns, use complementary approaches