Download
1 / 33
330 likes | 425 Views
Simplified Voltage Optimization M&V Protocols Getting to Delta V Regional Technical Forum Presentation April 6, 2010. Why We Are Here. Strengthen BPA Energy Conservation program offers Develop simplified process (based on Utility feedback) Address recommendations from the 6th Power Plan.

E N D
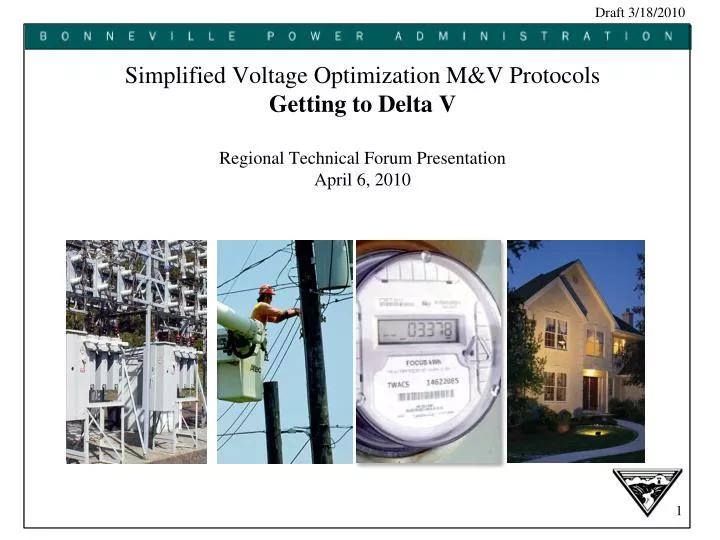
Simplified Voltage Optimization M&V ProtocolsGetting to Delta VRegional Technical Forum PresentationApril 6, 2010
Why We Are Here • Strengthen BPA Energy Conservation program offers • Develop simplified process (based on Utility feedback) • Address recommendations from the 6th Power Plan
BPA’s Overarching Goals • Develop a method of simplifying the delta V calculation for VO • Simplify /standardize utility participation process Key requirements: • Develop a work group to collaboratively work out the details of the Delta V calculation • Comply with Federal Energy Management Program M&V Guidelines • Develop a reasonable approach to ensure voltage optimization settings and operating practices are maintained • Build on consistent historical findings
Distribution Efficiency Technical Workgroup (TWG) BPA formed a collaborative group to work out the details of the method of simplifying the delta V calculation for VO. This group is made up of distribution engineering, energy efficiency, operations and GM staff. Their expertise and guidance has been critical to the development of the proposed method. The TWG collaboration site currently has 42 utility members.
Distribution Efficiency Technical Workgroup (TWG) Current TWG site members include:
What we seek from the RTF Committee From the April meeting • We want the RTF to form a sub-committee to review and comment on the proposed method of simplifying the delta V calculation for VO. • We want the committee to provide comments to Adam Hadley by mid April. This will allow the TWG to prepare a response to your questions in time for the May meeting. From the May meeting • During the meeting we will respond to comments received from the RTF and at the conclusion of the meeting we want the RTF to approve the simplified method of calculating VO Delta V as expressed in the protocols.
What This Presentation Covers • Energy conservation measure known as Voltage Optimization • Previous work performed by the RTF regarding this measure • Delta V (ΔV) calculation method • VO Factor (VOf) • Highlight consistent findings • Four stages of simplified VO calculation method • Copy of VO calculation document final drafts to provide the committee time to review and comment so that a May decision is possible
CVR / VO Clarification The measure known as Conservation Voltage Reduction or Regulation (CVR) has evolved over the last 30+ years and is widely known throughout the utility industry. The Simplified Protocols are different in that they ensure a certain level of distribution system stability prior to operating the system at a lower voltage. Thus we feel that Voltage Optimization (VO) is a more accurate description of this effort and will be using VO throughout this presentation.
Average Voltage Standard Practice Normal Voltage Operation 126 125 124 122 121 123 124 123 121 118 117 120 What Is Voltage Optimization? Volts 126 120 114 Feeder Length Normal Voltage Operating Range in Current Practice by Utilities 9
Average Voltage Standard Practice ΔV Average Voltage VO Practice ! • Mitigate/prevent risk of low voltage and customer power quality issues 126 125 124 122 121 123 Voltage Optimization 120 119 118 116 115 117 What Is Voltage Optimization? Volts 126 120 114 Feeder Length • System improvements • Flattens voltage profile and allows additional voltage reduction 10
Timeline of VO Related Events • February 2004 – Presentation of Automated CVR Protocol No. 1 • July 2004 – NEEA Distribution Efficiency Initiative begins • October 2005 – NEEA team presents and gains approval of statistical method to analyze results of NEEA Study • February 2008 – NEEA team presents NEEA Study results and general overview of calculator • March 2008– BPA hires Program Design Contractor to design VO Program • April 2008 – NEEA team presents CVR calculator in detail to RTF • May 2008 – RTF discusses calculator • July 2008 – RTF approves statement of works and budget to revise the calculator. BPA offers funding.
Timeline of VO Related Events continued • September 2008 – BPA opts to delay calculator enhancements until a simplified process can be built to support the use of the calculator • April 2009 – Contractor delivers first draft of Simplified VO M&V Protocols to BPA • July / Sept 2009 – BPA holds seven VO education & training workshops throughout the region • July 2009 – BPA formed a group to collaboratively develop a method to simplify the delta V calculation. This group is known as the Distribution Efficiency Technical Workgroup (TWG). • August to Present – Draft Program Design & Simplified VO M&V Protocols completed
From NEEA’s DEI research and pilot VO calculation method already “approved” by RTF From proposed protocols Method of Calculating Energy Savings (Delta V) Energy Saved = Change in voltage x Voltage Optimization Factor x Annual Energy + Energy Saved from System Improvements ESaved = ΔV x VOf x EAnnual +ΔESI • ΔV - determined from this program • VOf -derived from NEEA load research study and confirmed by EPRI studies, and other industry pilots and research • E Annual – Metered Data from Utility • ΔE - Energy Saved from System Improvements
Northwest VO Factor NEEA DEI End-Use Load Research Study Overall VOf of End-Use Load by Heating and Cooling Types Weighted to Northwest 1.0 0.8 0.6 0.4 0.2 0.0 VOf Non_Non_Elec(102) Non_Non_None(43) Elec_HeatPump(61) Elec_Non_None(22) Non_HeatPump(10) Elec_Elec_None(57) Elec_Non_Elec(17) Non_Elec_None(9) Elec_Elec_Elec(60) HotWater_SpaceHeating_Airconditioning (Qty) Electric Hot Water Heating & Electric Space Heating Electric Hot Water Heating OR Electric Space Heating Non-Electric Hot Water Heating & Non-Electric Space Heating
NEEA DEI Study VOf SensitivityMinor impacts due to AC End-Use Load 16% Variation
Previous Studies & Pilot Projects: Consistent Findings • California PUC 1976: Utilities were directed to modify service voltages to 120-114V where cost effective. [SDG&E – 8 feeders average CVRf of 0.7 to 1.0, Others reported CVRf as high as 1.3] • EPRI 1981-1984: An evaluation of the Conservation Voltage Reduction was performed (Project # 1419-1) and concluded “In the interest of energy conservation, it is recommended that the utility industry consider operating their distribution circuits such that the upper 5% of the permissible voltage band be eliminated.” [CVRf ~1.1 for Texas utilities] • BPA Study 1987: Assessment of Conservation Voltage Reduction Applicable in the BPA Service Area
Previous Studies & Pilot Projects: Consistent Findings • Northwest Utilities conduct CVR tests in late 1980’s: Some utilities adopted CVR practices [SnoPUD CVRf ~0.8] • NEEA – Distribution Efficiency Initiative (2003-2007): Established the VO factors based on heating and AC end-use loads for the Pacific Northwest. Confirmed and validated costs, benefits, and implementation options and tools. [ CVRf averaged 0.7 and up to 1.1] • EPRI Green Grid Initiative: Confirms the NEEA DEI Study results of 1 to 3 percent energy savings. Feb 2010, Public Utilities Fortnightly • Dominion Utility: Reported VO study findings of 0.8 VOf to PUC
Simplified VO M&V Protocols Outlining a New Approach Concentrating on Pre/Post Voltage Levels in order to determine Delta V
Four Stages to Simplified VO M&V Protocols 1. 2. 3. 4. Existing Performance Assessment and VO Implementation Plan Positive Results ? No Move to the next project Yes System Improvements Baseline Pre-VO measurements VO Implementation Post-VO Measurements and Verification Persistence of Energy Savings
Stage 1Existing Performance Assessment and VO Implementation Plan • Gather actual or estimated distribution system historical data that is readily available. • Perform preliminary assessment of distribution system existing level of performance. • Develop a preliminary improvement plan describing the system improvements needed to meet minimum operating performance thresholds for VO.
Stage 1: continuedExisting Performance Assessment and VO Implementation Plan • Develop preliminary plan for implementation of VO. • Estimate costs and propose preliminary schedules. • Calculate VO Factor using VO calculator. • Estimate potential savings of combined system improvements and VO. • Document all activities and results.
Stage 2: System Improvements and BaselinePre-VO measurement • Implement system improvements necessary to meet minimum operating performance thresholds. • Install equipment necessary to measure and/or operate VO with voltage control set for non-VO operation. • Perform pre-VO baseline measurements for 7-day period for each voltage control zone (VCZ). The detailed measurements are averaged over each hour (system must meet minimum performance thresholds during this 7-day period).
Why Performance Thresholds are Critical Establishing thresholds helps to resolve key issue found in pilot NEEA projects that did not perform well. • Reduces voltage fluctuation due to changing loads/conditions • More predictable voltage levels • Less likely to have have rogue lateral taps • Makes utility staff more aware of the feeder performance • Improves power quality • Reduces losses in the distribution system • Allows recording periods to be minimized (1 week to establish daily load shapes and weekend/weekday load shapes) • This is possible due to the linear nature of voltage drop and system loading and allows accurate calculations to determine annual average voltage levels.
Primary Voltage Zone Secondary Voltage Zone VCZ for LTC Transformer Feeder Load Tap Changer (LTC) Feeder Breaker Voltage Control Zones
Primary Voltage Zone Primary Voltage Zone Secondary Voltage Zone Secondary Voltage Zone VCZ for LTC VCZ for V-Reg Transformer Feeder V-Reg Load Tap Changer (LTC) Feeder Breaker Voltage Control Zones
Stage 2: continuedSystem Improvements and Baseline Pre-VO Measurement • Identify final installation cost of system improvements including VO equipment. (if applicable). • Determine baseline pre-VO overall annual average voltage for all VO voltage-control-zones (VCZ) with voltage control set for non-VO operation. VCZ consist of all distribution lines that are controlled by a tap changing voltage regulator. Several VCZ may exist within one substation area. • Calculate savings from system improvements. • Document all activities and results.
Stage 3: VO Implementation and Post-VOMeasurements and Verification • Prepare an initial estimate of energy savings resulting from VO using distribution system known or estimated customer load characteristics. • Initiate VO operational voltage control. • Perform post-VO measurements for 7-day period. The detailed measurements are averaged over each hour (system must meet minimum performance thresholds during this 7-day period).
Stage 3: continuedVO Implementation and Post-VOMeasurements and Verification • Determine post-VO overall annual average voltage for all VO voltage-control-zones (VCZ) with voltage control set for VO operation. VCZ consist of all distribution lines that are controlled by a tap changing voltage regulator. Several VCZ may exist within one substation area. • Prepare a final post-VO verified estimate of energy savings resulting from VO. • Document all activities and results.
Stage 4: Persistence of Energy Savings • For a three year period, complete annual self-certification checklist to ensure: • Voltage settings are still operating as prescribed within the prescribed VO voltage control zones. • Voltage control zone continues to meet minimum performance thresholds. The annual self-certification of system minimum operating performance is measured over a 12 month period. NOTE: TWG feels a process that’s been in practice for 3 years becomes a standard operating procedure and is highly likely to continue.
Project Team • Bonneville Power Administration • Distribution Efficiency Technical Workgroup • GOALmind Consulting - Jillianne Welker • RMH Consulting - Bob Helm • RW Beck - KC Fagen • Utility Planning Solutions - Robert Fletcher
Call for Dedicated Sub- Committee Need review, comments and recommendations on the document Simplified VO M&V Protocols (approx. 10 pages) which describes the method for simplifying the delta V calculation for VO. All comments must be sent to Adam Hadley by April 19, 2010.
Thank you very much for taking the time to shareyour knowledge & experience.