Download
1 / 44
440 likes | 446 Views
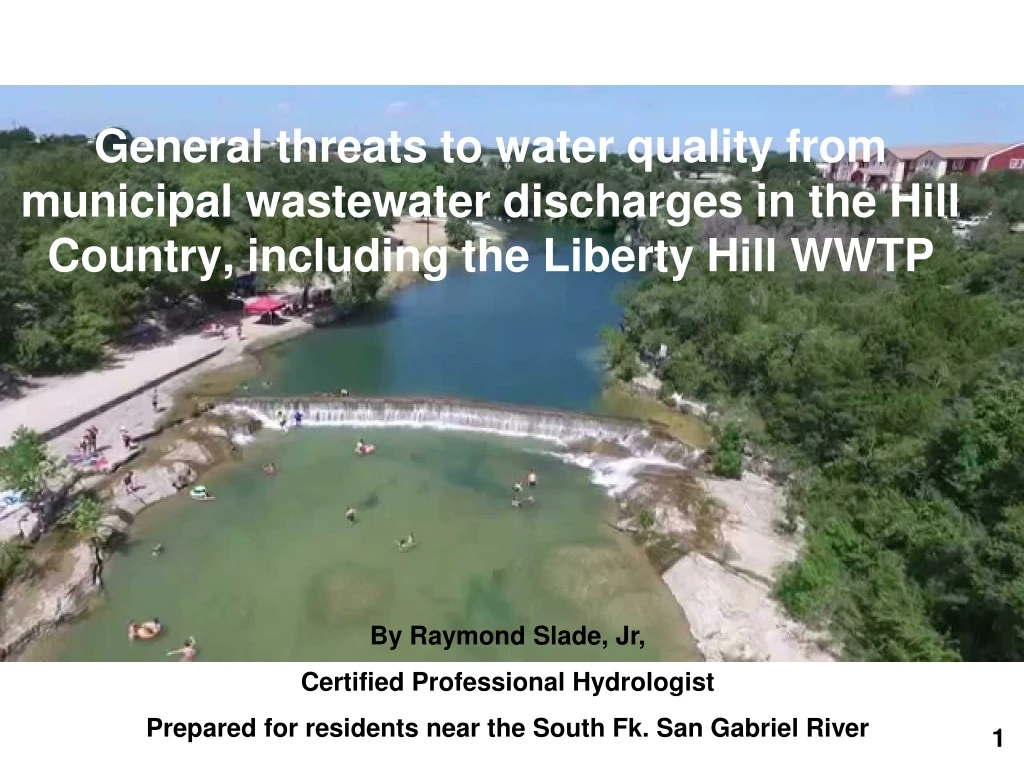
General threats to water quality from municipal wastewater discharges in the Hill Country, including the Liberty Hill WWTP. By Raymond Slade, Jr, Certified Professional Hydrologist Prepared for residents near the South Fk. San Gabriel River. 1. Order of contents. Introduction and background

E N D
General threats to water quality from municipal wastewater discharges in the Hill Country, including the Liberty Hill WWTP By Raymond Slade, Jr, Certified Professional Hydrologist Prepared for residents near the South Fk. San Gabriel River 1
Order of contents • Introduction and background • Wastewater treatment plants in Texas versus remainder of the U.S. • 8 major water-quality threats from wastewater due to missing or lax rules • Compliance for WWTP’s in the Texas Hill Country • Information about the Liberty Hill WWTP Source for material in each slide identified at bottom of slide
4 Anybody know when the greatest inflow occurs to WWTPs? Half time during the Super Bowl—beer drinking and toilet flushing. True.
Source of TCEQ rules 3 • Chapter 30 (Texas Water Code) of the Texas Administrative Code covers rules to be enforced by the Texas Commission on Environmental Quality http://www.tceq.texas.gov/rules/indxpdf.html • Section 213.6 and 309 covers rules that apply to effluent disposal in this area. Addressed are two procedures for effluent disposal-- discharge into streams and land disposal. • Applications made to TCEQ for disposal permits.
Background • Across Central Texas, occurring is a proliferation of permit applications to discharge treated wastewater directly into local streams. • Population increases are causing utilities to expand services, and many do not have the technical or financial resources to explore alternatives. • Effluent contains high levels of nutrients—nitrogen (N) • and phosphorus (P), whichoften cause eutrophication, • death of biological species, and algae in streams. Visible • algae often subjects WWTPs to public scrutiny. • However, WWTPs discharge an invisible but much greater • threat—that to human health in the form of unregulated • contaminants within wastewater.
Municipal wastewater treatment options TCEQ permits all wastewater treatment facilities which must follow State standards Fertilizer for fields Bio-solids fertilizer
Municipal wastewater discharges in Texas versus remainder of United States (EPA) • Texas has the most facilities--1812. • Texas has most major (>1 mgd) facilities--489. PA is second with 291. • Only 7% of Tx major facilities have imposed nitrogen (N) or phosphorus (P) limits, compared with 34% for the entire U.S. • Monitoring requirements for N or P are required for only 4% of major TX facilities, compared with 63% Nationwide. • Tx is at the bottom or near the bottom of the list for percent of facilities with N or P limits, and for N or P monitoring. https://www.epa.gov/npdes/status-nutrient-requirements-npdes-permitted-facilities
Major threats to water quality due to missing or lax rules 1. Permits do not address many pollutants in wastewater 2. Wastewater quality limits are too lax 3. Permits issues despite evidence that the discharge would threaten downstream waters 4. Improper water-quality monitoring of wastewater to assure compliance 5. No required monitoring of receiving surface or groundwater for contamination from the wastewater 6. TCEQ does not limit phosphate levels in non-laundry detergents 7. Lack of effective TCEQ management of wastewater facilities 8. Edwards aquifer vulnerable to contamination—not addressed herein Details and examples for these issues are presented in the following slides
1. Permits do not address many pollutants in wastewater • Water-quality criteria for wastewater permits address only 2 to 6 (shown below) of hundreds of contaminants. Threatening water-quality constituents not addressed in permitting include emerging contaminants, minor elements, pesticides, herbicides, and organic carbon. CBOD--Carbonaceous Biochemical Oxygen Demand: measurement of organic pollution--depletion of dissolved oxygen by biological organisms TSS--Total Suspended Solids: algae cells, bacteria, protozoa, silt… NH3--Ammonia Nitrogen P--Phosphorus NO3--Nitrate Nitrogen E. Coli--Bacteria • Example--emerging contaminants, addressed on next 7 slides Time and emphasis are given to this issue because of its presence in wastewater and threat to health.
Emerging contaminants • Wastewater discharges contain many pharmaceuticals, personal care products, surfactants, various industrial additives, and numerous organic chemicals identified as Endocrine Disrupting Chemicals (EDCs). • U.S. Geological Survey studies downstream from 10 wastewater treatment plants documented 78 EDCs in wastewater discharges, of which 37 are prevalent in most such discharges. • At least one-half of the 37 EDCs were detected at all sites and 11 of the EDCs were detected at every wastewater site. • Sampling upstream from the wastewater sites found detections of and concentrations of EDCs there to be substantially less than found downstream from wastewater sites. http://digitalcommons.unl.edu/usgsstaffpub/66
Google search of “EDC’s in wastewater identified 614,000 hits
2 Unused drugs often disposed by flushing Large portion of many drugs not metabolized thus are excreted
Emerging contaminants not removed by conventional WWTP or WTP. However, technology exists for removal. Stream or reservoir
Emerging contaminants (cont.) • Studies suggest that the effect of EDCs exposure on human health includes reproductive malfunctions, a decrease in male sperm count, and an increase in testicular, prostate, ovarian and breast cancers. • The significant concern is toward fetuses and newborn babies because they are the most vulnerable. https://www.researchgate.net/publication/222170953_A_Review_of_the_Effects_of_Emerging_Contaminants_in_Wastewater_and_Options_for_Their_Removal
What EDCs Influence? • Endocrine Systems Produce: • hormones • chemicals • messengers • Regulates: • mood • growth & development • tissue function • metabolism • sexual function • reproductive processes Greater concern to fetuses and newborn babies because they are the most vulnerable. Source: University of Maryland Medical Center https://www.epa.gov/endocrine-disruption
Emerging contaminants (cont.) last one • Some EDCs detected in wastewater represent estrogenic pesticides and pharmaceuticals, which operate through estrogen receptors in their target cells--their effects are additive. • Therefore, a minimally safe exposure level does not exist because any dose adds to natural estrogens already present. • Wastewater contaminated water supplies will produce continued exposure and cumulative levels of estrogenic hormonal chemicals in humans. • EDC’s not addressed in Tx for permitting wastewater discharges http://www.awra.org/impact/issues/0705impact.pdf https://www.sciencedirect.com/science/article/pii/S2405665016300361
2. Wastewater quality limits are too lax • The most stringent water-quality limits for the 4 constituents are based on 30-day average values—but even those levels are much higher than allowed for drinking or recreational use and to prevent eutrophication (addressed later). • However, wastewater in Hill Country streams including the S Fk San Gabriel can travel miles and be in aquifers in less than one day. • Much less stringent levels allowed for grab (instantaneous) samples. • Example—TCEQ and proponents for WWTP’s argue that flow in channels will dilute effluent and vegetation will absorb WWTP nutrients. Next 6 slides address this.
Little if any vegetation in typical Hill Country stream channels and almost every stream is dry on occasion. Therefore dilution and uptake of WWTP nutrients limited. 32
Results of wastewater discharges in Hill Country streams Barton Creek below Lost Creek effluent irrigation Blanco River below Blanco WWTP
Brushy Creek downstream from Leander WWTP City of Austin PPT presentation, 2009
South Brushy Creek downstream from Cedar Park WWTP City of Austin PPT presentation, 2009
Lake Creek downstream from Anderson Mill WWTP City of Austin PPT presentation, 2009
Large amounts of algae blanketed the South Fork of the San Gabriel River on May 8 outside of a Georgetown couple’s home. The TCEQ determined the algae was caused by an unauthorized dumping of sludge by a city-operated wastewater treatment plant in Liberty Hill. July 18, 2018 https://www.mystatesman.com/news/local/report-sludge-dumped-into-river-wastewater-plant-caused-algae/lNYGS6ElAzyE3FqXev31WN/ 33
TCEQ sponsors USGS study of water quality for Tx Hill Country streams receiving effluent discharges • Study done 12 years ago and 16 streams sampled • Total N values for streams with wastewater 5 times greater than streams without wastewater • Total P in streams with wastewater 183 times greater than streams without wastewater • Median total nitrogen value for samples from wastewater basins 6 times greater than level causing eutrophication • Median total phosphors value for samples from wastewater basins 48 times greater than level causing eutrophication https://pubs.usgs.gov/sir/2007/5195/
3. Permits issued despite evidence that the discharge would threaten downstream waters • TCEQ conducts an administrative hearing before a permit is granted. TCEQ allows some effected parties to participate and present evidence (with limitations) but minimal consideration is given to the threat that such discharges pose to the environment. • Example--Dripping Springs was issued a discharge permit despite evidence from the City of Austin, the BSEACD and many others, including the author of this presentation, that such a discharge would threaten Onion Creek, nearby wells, Barton Springs, and the drinking water for many people.
4. Improper water-quality monitoring of wastewater to assure compliance • Water-quality monitoring to assess compliance is self conducted and self reported to TCEQ based on 1 or 2 grab samples per week. These limited data do not verify that permitted “30-day average values” for the water-quality constituents are less than permitted levels. • Also, these data do not verify that the peak instantaneous level is below that permitted. • Plant employees choose when to sample.
5. No required monitoring of receiving surface or groundwater for contamination from the wastewater • Routine monitoring is not done to assure that permitted discharges are not impacting downstream water supplies • For example, monitoring programs to document downstream (or receiving aquifer) water quality for any changes due to wastewater could readily be established and would typically provide overwhelming evidence regarding such. As partial criteria for permit, perhaps the WWTP owner should be responsible for the monitoring cost and the cost of a remedy for any impacted waters.
6. TCEQ does not limit phosphorus levels in non-laundry detergents • Phosphorus is banned Nationwide from laundry detergents but not banned for other detergents. Dishwashing detergents contribute up to 34% of phosphorus in wastewater. • 17 states ban or severely limit phosphorus in dishwashing detergents but Texas does not. http://oars3rivers.org/take-action/whatyoucando/detergents
7. Lack of effecive TCEQ management of wastewater facilities • TCEQ has a “self audit” program. • TCEQ makes infrequent or no visits to inspect facilities and announces such visits in advance. • Violators are typically given multiple “Notice of Violation” written warnings, even for the same offenses, and given extended periods to become compliant. The next step is administrative orders which are seldom used. This can be followed by civil enforcements (with fines) and finally criminal charges but these are rarely used. Additionally, some violators pay enforcement action fines rather than becoming compliant because the fines might be cheaper than the cost of becoming complaint. • Examples follow
Compliance and enforcement for municipal wastewater discharge permits within the Texas Hill Country • The permitted discharge for the 48 facilities totals about 303 million gallons per day--9 times greater than the mean flow from Barton Springs. • • Three of the facilities (Kerrville, Pflugerville, and Sabinal) were non compliant during 11 of the 12 quarters during the past 3 years. • • 31 of the 48 facilities were non compliant as of September 22, 2018. • • During the past 3 years, the facilities in New Braunfels, Kyle and Pflugerville had the most number of effluent violations with 129, 50 and 36 respectively. • • About 1/3 of the facilities (15 0f 48) had only one on-site inspection during the past 5 years. • • During the past 3 years, the 48 facilities had 411 violations, an average of 8.6 violations per facility. • • Despite 411 violations in the past 3 years, only 38 formal enforcement actions were issued during the past 5 years. http://www.hillcountryalliance.org/wp-content/uploads/2018/09/TRDES_TCEQPermitViolations_Slade_2018.pdf
Liberty Hill WWTPWastewater outfalls in Williamson County About 21 https://www.tceq.texas.gov/gis/wastewater-outfalls-viewer
Perspective of S FK San Gabriel R and LH WWTP HWY 183 Burnet Liberty Hill WWTP IH 35 http://www2.twdb.texas.gov/apps/WaterDataInteractive/GroundWaterDataViewer
Water wells proximate to S FK SG River downstream from LH WWTP IH 35 LH WWTP outfall Hwy 183 scale Stream reach from Hwy 183 to IH 35 looses and gains water from aquifer Therefore some of the effluent probably enters the aquifer http://www2.twdb.texas.gov/apps/WaterDataInteractive/GroundWaterDataViewer
Comparison of wastewater-quality criteria and protection criteria For wastewater,maximum 30-day average values inred, single grab sample value inblue no limits where dashed EPA limit for public water supply: NO3=10 Limits for Liberty Hill WWTP CBOD 5 30 TSS 5 30 NH3 2 15 P 0.5 0.9 NO3 16.6 99.6 Tot N 18.6115 Maximum limit to protect biological species, and prevent algae and eutrophication EPA: total N = 0.25 P = 0.023 Burnet S FK SG -- Wastewater limits for other areas CBOD 20 65 TSS 20 65 NH3 -- -- P -- -- DO -- 2 (min.) TCEQ defined Edwards aquifer contributing zone Background water quality values for local streamsCBOD <1 TSS 1-5 NH3 < 0.05 P 0.006 NO3 <0.5 11 No discharges allowed on the Edwards aquifer 0 miles 20 9
Water quality limits for Liberty Hill WWTP • The limit for grab-sample nitrate plus ammonia nitrogen for the Liberty Hill WWTP is about 115 ppm which is 460 times greater than the threshold for eutrophication and thus algae. • The limit for phosphorus for the Liberty Hill WWTP is 3 ppm revised to 0.9 ppm when plant expansion is completed. These levels are 130 and 39 times greater than threshold for eutrophication. • The daily limit for E. coli bacteria is 399 colonies per 100 ml—studies show this level to be 3.2 times greater than the level (126 col./100 ml) which caused an estimated illness rate of about 4% of people in recreational contact. https://www.epa.gov/sites/production/files/2015-10/documents/rwqc2012.pdf
Selected violations for the Liberty Hill WWTP • 2013: fined $6,000--ordered to replace or repair failing system • 2014: 5 violations & 1 issue. 1 violation-- for algae in river • 2016: 5 violations & 3 issues. 1 issue--self reported violation of water quality limits between Oct 2015 and Oct 2016 • 2017-2018: additional violations • Nov 2016 – May 2018: 59 self reported effluent violations. Five of the self-reported violations from the past yearwere for exceeding E. coli (bacteria) limits. The plant has a history of E. coli violations, some self-reported and some discovered by TCEQ, dating back at least 6 years. • Current: 1 pending enforcement action • Note: it is very difficult to obtain historical records of non compliance for TCEQ permitted facilities. Such records typically are aggregated by time periods and not by facility.
I was informed that TCEQ put out a notice on May 31 that they are drafting a new permit for the South Fork plant which is believed to be the renewal of their existing permit. The public might be able to provide comments. https://www.tceq.texas.gov/agency/decisions/cc/pub_notice.html
LH WWTP permit water-quality non compliancePercent by which monthly values exceeded permitted values Year and quarter Worst monthly value shown for each quarter https://echo.epa.gov/detailed-facility-report?fid=TX0126195&sys=ICP Number of quarters with non compliance last 3 years = 12 Number of months with non compliance last 3 years = 29 Number of effluent violations last 3 years = 82 https://echo.epa.gov/trends/loading-tool/reports/effluent-exceedances?permit_id=TX0126195&start_date=01/01/2015&end_date=12/31/2019
Mixture of natural streamflow and wastewater for S. Fk. San Gabriel River LH Permit—current max 2 mgd expanding to 4 mgd with peak 9,028 gpm for 2 hours RR Blvd USGS streamflow gage on S Fk S.G. has 15-minute flow data from 1967-date Hwy 183 Liberty Hill WWTP 2 mgd Example--gph Flow upstream from WWTP varies from 0 to billions of gpd. 42% of time, flow upstream from WWTP is less than 2 mgd. Flow direction S FK San Gabriel R IH 35 Therefore, total flow in river downstream from WWTP dominated (at least half) effluent 42% of time At wastewater discharge of 9,028 gpm, total flow in river downstream from WWTP at least half effluent 60% of the time. https://waterdata.usgs.gov/nwis/uv?site_no=08104900
USGS has been collecting water-quality data for many years at many sites—data that can be used to assess impacts of WWTPs
TCEQ has been collecting water-quality data for many years at many sites as part of the Clean Water Act sec 303 (d) and 305 (b)—data that can be used to assess impacts of WWTPs
Water-quality data for S FK San Gabriel R LH WWTP outfall Red dots = TCEQ sampling sites IH 35 Site 21739 17 samples 2015-2018 366 analyses Hwy 183 Site 12115 144 samples 1986-2018 3160 analyses. USGS 21 samples 1962-2001 Site 20309 53 samples 2007-2018 1681 analyses S Fk San Gabriel R Site 12116 113 samples 1987-2018 3062 analyses RR Blvd About 5 Samples per year (still being collected) on same dates and proximate in time Cost for these samples and analyses about $500,000—data include TSS, N, P, and E. Coli • These data can be used to assess water quality and flow from the LH WWTP • Document change in water-quality values between Hwy 183 site and downstream sites to assess water quality from the WWT • Document degradation over time for values downstream from WWTP. The degradation likely mostly due to water from the WWTP • 3. Streamflow (mgd) measured at time of each sample—increase in flow mostly due to water from WWTP. Flow at RR blvd minus flow at Hwy 183 = plant outflow https://www80.tceq.texas.gov/SwqmisPublic/index.htm
No questions? Good Bye