Download
1 / 8
80 likes | 444 Views
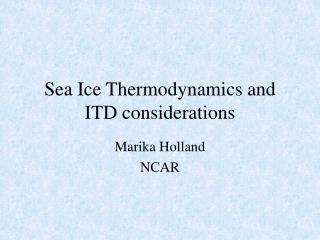
Atmospheric Thermodynamics Responsible for the Antarctic Circumpolar Wave Along the Sea Ice Edge Around Antarctica. Per Gloersen Cryospheric Sciences Branch, Hydrospheric & Biospheric Sciences Laboratory, Earth-Sun Exploration Division, (Per.gloersen@nasa.gov).

E N D
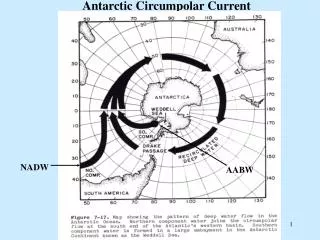
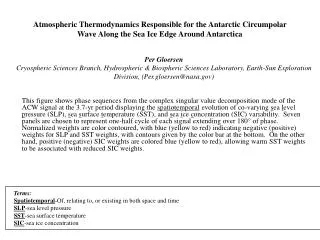
Atmospheric Thermodynamics Responsible for the Antarctic Circumpolar Wave Along the Sea Ice Edge Around Antarctica Per Gloersen Cryospheric Sciences Branch, Hydrospheric & Biospheric Sciences Laboratory, Earth-Sun Exploration Division, (Per.gloersen@nasa.gov) This figure shows phase sequences from the complex singular value decomposition mode of the ACW signal at the 3.7-yr period displaying the spatiotemporal evolution of co-varying sea level pressure (SLP), sea surface temperature (SST), and sea ice concentration (SIC) variability. Seven panels are chosen to represent one-half cycle of each signal extending over 180° of phase. Normalized weights are color contoured, with blue (yellow to red) indicating negative (positive) weights for SLP and SST weights, with contours given by the color bar at the bottom. On the other hand, positive (negative) SIC weights are colored blue (yellow to red), allowing warm SST weights to be associated with reduced SIC weights. Terms: Spatiotemporal-Of, relating to, or existing in both space and time SLP-sea level pressure SST-sea surface temperature SIC-sea ice concentration
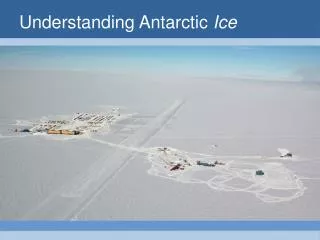
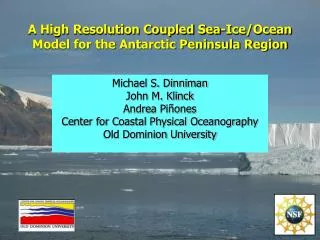
Low Temperature SEM of Snow Crystal Metamorphism in Winter Snow Covers James Foster, A. Rango, E. Josberger, E. Erbe, C. Pooley,and W. Wergin Hydrological Sciences Branch, Hydrospheric & Biospheric Sciences Laboratory Earth-Sun Exploration Division (james.l.foster@nasa.gov) Study: Seasonal snow cover results from the precipitation and accumulation of highly complex snow crystals. With passing time and continued accretion, these crystals are subjected to internal pressures, as well as local climatic factors, such as sun exposure, temperature variability, precipitation rates and wind history, that result in gradual, complex changes or metamorphoses of the snow crystals. Various forms of metamorphism may occur and the specific types of crystals that result may influence the radiative properties of the snow cover, avalanche potential and the interactions between the snow, soils and vegetation . For these reasons, visualizing and understanding snow crystal metamorphism in snow cover is an important endeavor. Sturm et al. (1995) suggest that worldwide snow covers can be grouped into six classes, tundra, taiga, alpine, maritime, prairie and ephemeral, which correspond to specific climatic regimes. Each class has unique textural and stratiographic features, including snow crystal morphology. However, studies of the structural features of crystal morphology within these classes is somewhat limited by the light optics that are used to characterize the snow crystals. In recent years, low temperature, scanning electron microscopy (LTSEM) has provided a new and powerful technique for examining snow and ice. In the current study, LTSEM is used to describe and compare the structures of metamorphosed snow crystals in three classes of seasonal snow covers, namely prairie, taiga and alpine. Snow crystals were collected from a snow pits at 10 cm intervals by using a pre-cooled (LN2) scalpel to gently dislodge the crystals from the pit wall onto a copper plate containing a cryo-adhesive. Immediately after a specimen was collected, the plate containing the adhesive and the sample was plunged into a vessel of LN2. In all subsequent procedures, including shipping, storing, coating, observing, and photographing, the plates containing the samples were maintained at temperatures ranging from -1100 to -1960C. Conclusion: Based on these observations, LTSEM appears to be a valuable technique for characterizing snow crystal metamorphosis in snow covers and will help us to understand how environmental and physical factors influence these changes.
Figure 1 Figure 1 Early metamorphosis of snow crystals – they have lost their sharp edges and have become rounded and sintered (formed into a mass by heat and pressure . Sample obtained 5 cm below surface of an alpine snow cover. In the upper layers, the dendritic crystals had well-defined edges that could be clearly observed.
Figure 2 Large depth hoar crystal with a “stepped” internal depression. Sample obtained 5 cm from base of a prairie snow cover, where large, loosely sintered depth hoar crystals were found. These crystals were commonly 2 to 3 mm in length and had flat outer faces with sharply defined angles.
Hurricane Erin (2001) Brightness Temperature Simulations • “Summary: Complex Cloud-Radiative Interactions” • Gail Skofronick-Jackson • Instrumentation Sciences Branch, Hydrospheric & Biospheric Sciences Laboratory, • Earth-Sun Exploration Division (gail.s.jackson@nasa.gov) • Description: • The 4th Convection and Moisture Experiment (CAMEX-4) based from Jacksonville, FL in 2001 recorded observations from multiple airborne, ground based and satellite instruments. Of interest are the ER-2 Doppler Radar (EDOP), the Advanced Microwave Precipitation Radiometer (AMPR), the High-Altitude MMIC Scanning Radiometer (HAMSR) and the ER-2 dropsondes. • This work compares the HAMSR and AMPR observations to computed brightness temperature (TB) values using EDOP, the dropsondes, and simulated clouds to initialize the cloud profiles. • Figure Captions (Clockwise from Left Side) NEXT SLIDE: • Co-located EDOP radar image with HAMSR and AMPR data sets. Note HAMSR 166 and 183 GHz sensitivity to high ice clouds. Note AMPR 10 GHz sensitivity to low rain clouds. • GOES image of Hurricane Erin with ER-2 flight track superimposed. Pink arrow indicates sampling area of the EDOP, HAMSR, and AMPR images. • Surface rainfall rates for the Mesoscale Model (MM5) simulated clouds for Hurricane Erin. • Comparisons between the observations and calculations with (1) a Sehkon-Srivastava ice particle size distribution (PSD) and using MM5 for the temperature, pressure, and relative humidity profiles, (2) a Sehkon-Srivastava ice particle PSD and using dropsonde data for T, Pres, and RH, (3) using a fluffy snow PSD. Comparisons are shown for 10, 55.5, and 183±10 GHz. • Comments: • 10 GHz: Mostly sensitive to liquid water and near surface conditions. • a) Computed TB in rainbands match observations well, thus EDOP retrieved liquid ok. • b) Computed TB in eye is too cold, thus dropsondes and H. Erin simulations are not appropriate. • 55.5 GHz: Mostly sensitive to tropospheric cloud temperature profile. • a) H. Erin simulation tropospheric T profile is too warm in eye. • b) Dropsondes match upper altitude temperature profile better. • 183±10 GHz: Mostly sensitive to ice particle scattering. • a) Fluffy snow particles do not produce enough cooling from scattering. • b) Sehkon-Srivastava ice particle PSDs produce too much cooling from ice scattering. • c) Expect that realistic PSDs & better scattering & asymmetry models will improve comparison. • Difficult to put all cloud profile components together to make calcs match wideband observations.
GOES (ER-2 flight) Hurricane Erin (2001) Brightness Temperature Simulations Dr. Gail Skofronick Jackson, Code 614.6 MM-5 Simulation EDOP HAMSR HAMSR AMPR
Chlorophyll and SST around New Zealand’s North Island Gene Feldman, Ocean Sciences Branch, Hydrospheric & Biospheric Sciences Laboratory, Earth-Sun Exploration Division (gene.c.feldman@nasa.gov) The subtropical front is visible in this MODIS scene both in the temperature and the chlorophyll field as it stretches eastward from New Zealand along the ChathamRise. Also visible in the data are regions of upwelling in and south of Cook Strait and around the three capes: Reinga, East (on the North Island), and Farewell (on the South Island). Two warm spots in the sea surface temperature field -- one on either side of the North Island -- show no obvious correlation with the chlorophyll signal.