Download
1 / 22
220 likes | 324 Views
Solve various function-related problems, including finding domains, ranges, and evaluating expressions. Explore polynomial, rational, and exponential functions with step-by-step instructions.

E N D
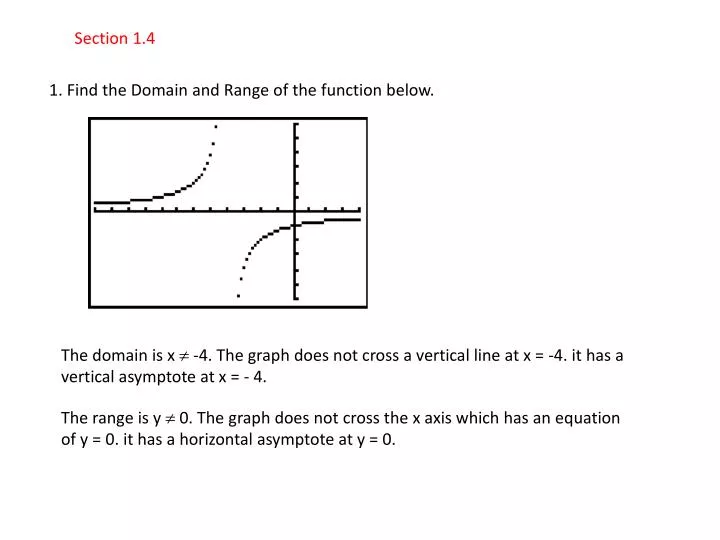
Section 1.4 1. Find the Domain and Range of the function below. The domain is x -4. The graph does not cross a vertical line at x = -4. it has a vertical asymptote at x = - 4. The range is y 0. The graph does not cross the x axis which has an equation of y = 0. it has a horizontal asymptote at y = 0.
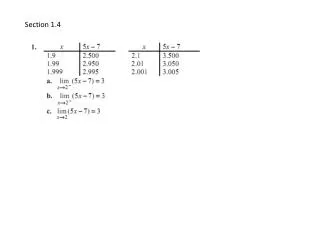
2-3 For each function: • Evaluate the given expression • Find the domain of the function. • Find the range. [Hint: Use a graphing calculator] 2.
2-3 For each function: • Evaluate the given expression • Find the domain of the function. • [Hint: Use a graphing calculator] 3. G (x) = 4 x ; find g ( - 1/2). a. Plugging -1/2 in for x yields 4 -½ = 1/2. • Graph the function and the table will show that all x work for the domain. • OR • Note that the function does not have division or even roots so all real numbers work.
Solve by factoring 4. Factor out the common factor 2 x ½ . So x = 0. x = 1 and x = -3 You can also graph this function on your calculator and find the x-intercepts – zeros.
Graph the function 6. It is the absolute value function shifted 3 down and 3 to the right.
7-10 Identify each function as a polynomial, a rational function. an exponential function, a piecewise linear function, or none of these. (Don’t graph them, just identify their types) 7.
8. Polynomial or linear function.
10. It is not a polynomial function because one of the exponents is not an integer.
For 11-14 each function find and simplify Assume h 0. 11. f (x) = 5x 2. Step 1. f(x + h) = 5 (x + h) 2 = 5x 2 + 10 xh + 5h 2 Step 2. f(x) = 5x 2 Step 3. f(x + h) – f (x) = 10 xh + 5h 2 Step 4.
12. Step 1. f(x + h) = 7 (x + h) 2 – 3 (x + h) + 2 = 7x 2 + 14 xh + 7h 2 -3x – 3h + 2 Step 2. f(x) = 7x 2 – 3x + 2 Step 3. f(x + h) – f (x) = 14 xh + 7h 2 – 3h Step 4.
13. Step 1. f(x + h) = (x + h) 3 = x 3 + 3x 2 h + 3xh 2 + h 3 Step 2. f(x) = x 3 Step 3. f(x + h) – f (x) = 3x 2 h + 3xh 2 + h 3 Step 4.
14. Step 1. Step 2. Step 3. With a bit of arithmetic work in subtracting fractions this becomes - Step 4. We are dividing step 3 by h or multiplying by 1/h.
15. Social Science: World Population The world population (in millions) since the year 1700 is approximated by the exponential function p (x) = 522 (1.0053) x where x is the number of years since 1700 (for 0 ≤ x ≤ 200) Using a calculator, estimate the world population in the year 1750.
16. Economics: Income Tax The following function expresses an income tax • that is 10% for incomes below $5000, and otherwise is $500 plus 30% of income • in excess of $5000. • Calculate the tax on an income of $3000. • Calculate the tax on an income of $5000. • Calculate the tax in an income of $10000 • Graph the function. • For x = 5000 use f(x) = 500 + 0.30(x – 5000) • f (x) = 500 + 0.30(5000 – 5000) = $500 • c. For x = 10000 use f(x) = 500 + 0.30(x – 5000) • f (x) = 500 + 0.30(10000 – 5000) = 500 + 1500 = $2000.
16. Economics: Income Tax The following function expresses an income tax that is 10% for incomes below $5000, and otherwise is $500 plus 30% of income in excess of $5000. d. Graph the function.
17. The usual estimate that each human-year corresponds to 7 dog-years • is not very accurate for young dogs, since they quickly reach adulthood. • Find the number of dog years corresponding to the following amounts of • human time: 8 months, 1 year and 4 months, 4 years, 10 years. • b. Graph the function • The following function expresses dog years as 10.5 dog years per human year • for the first 2 years , and then 4 dog years per human years for each year thereafter: In part a, 8 months is 2/3 years and 1 year and 4 months is 4/3 years.
17. The usual estimate that each human-year corresponds to 7 dog-years • is not very accurate for young dogs, since they quickly reach adulthood. • Find the number of dog years corresponding to the following amounts of • human time: 8 months, 1 year and 4 months, 4 years, 10 years. • b. Graph the function • The following function expresses dog years as 10.5 dog years per human year • for the first 2 years , and then 4 dog years per human years for each year thereafter:
18. BONUS HOMEWORK! Business: Insurance Reserves: An insurance company keeps reserves (money to pay claims) of R(v) = 2v 0.3 , where v is the value of all if its policies, and the value of it’s policies is predicted to be v(t) = 60 + 3t, where t is the number of years from now. (Both r and v are in the millions of dollars.) Express the reserves R as a function of t, and evaluate the function at t=10.
19. Biomedical: Cell Growth One leukemic cell in an otherwise healthy mouse • will divide into two cells every 12 ours, so that after x days the number of leukemic • cells will be f (x) = 4 x . • Find the appropriate number of leukemic cells after 10 days. • If the mouse will die when its body has a billion leukemic cells, will it • survive beyond day 15?