Decision Analysis
Decision Analysis. Summer 2013. Let us flip a fair coin once (there is a fee). If you win I give you $102. If I win, you give me $100. How much fee will you pay me for playing the game: $5, $2, $1, $0? You can select any other amount. Let us flip a fair coin 1000 (there is a fee).

Decision Analysis
E N D
Presentation Transcript
Decision Analysis Summer 2013 DecisionAnalysis
Let us flip a fair coin once (there is a fee). • If you win I give you $102. If I win, you give me $100. • How much fee will you pay me for playing the game: $5, $2, $1, $0? You can select any other amount. • Let us flip a fair coin 1000 (there is a fee). • If you win a toss, I give you $102. If I win, you give me $100. • How much fee will you pay for the playing the entire game? • Suppose you are getting ready to go the office in a crowded metro. Carrying an umbrella is a hassle; you will carry it only when you feel necessary. Forecast for today is 70% chance of rain and the sky is overcast. Should you carry an umbrella - Yes or no? • My decision would be “Yes” and it is a good decision. • However, there are two possible outcomes- it will rain or not. • If it does not rain, it does not mean I have made a bad decision. DecisionAnalysis
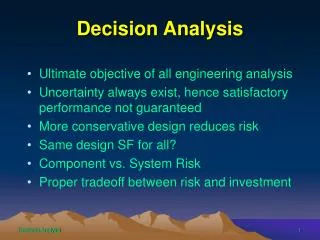
Decision Analysis (DA) • DA is a methodology applicable to analyze a wide variety of problems. • Although DA was used in the 1950s (at Du Pont) and early 1960s (at Pillsbury), major DA development took place in mid sixties. One of the earliest application (at GE) was to analyze whether a super heater should be added to the current power reactor. • DA has been considered as a technology to assist (individuals and) organizations in decision making by quantifying the considerations (even though they may be subjective) to deduce logical actions. DecisionAnalysis
Decision Analysis (DA) One can discuss many topics listed below; we will look at a few. • Problem Formulation. • Decision Making with / without Probabilities. • Risk Analysis and Sensitivity Analysis. • Decision Analysis with Sample / Perfect Information. • Multistage decision making. • Tools and terminology • Basic statistics and probability • Influence diagram / payoff table / decision tree • EMV: Expected Monetary Value • EVSI / EVPI : Expected Value of Sample / Perfect Information • Bayes’ rule • Decision vs. outcome • Risk management • Minimax / maximin / • Utility theory DecisionAnalysis
Decision analysis without probabilities Concepts covered: Payoff table. Different approaches: Maximax, maximin, minimax regret • Example: There are four projects; I can select only one. The payoff table shows potential “payoff” depending upon likely economic conditions. • Since the payoff in project C is higher than the payoff for D for every economic condition, we say that project C is dominant. • We can eliminate project D from consideration. DecisionAnalysis
Maximax • If you are an optimist, you will decide on the basis of Maximax. Step 2:Then pick the alternative with max payoff. DecisionAnalysis
Maximin • If you are a conservative you will use Maximin. 2: Then pick the alternative with max payoff. DecisionAnalysis
Minimax Regret • You are neither optimist nor conservative. • Step 1: Calculate the maximum for each outcome. 4075| 7000| 12080 • Stet 2: Prepare “Regret Table” by subtracting each outcome cell value from its maximum. • At least one number for each regret table outcome is zero and there are no negative numbers. Why? DecisionAnalysis
Minimax Regret.. 4075| 7000| 12080 DecisionAnalysis Step 4: Pick the alternative with minimum regret.
General comments • Table columns show outcomes (also called state of nature). • The maximax payoff criterion seeks the largest of the maximum payoffs among the actions. • The maximin payoff criterion seeks the largest of the minimum payoffs among the actions. • The minimax regret criterion seeks the smallest of the maximum regrets among the actions. The above three approaches we used involved Decision Making without Probabilities. DecisionAnalysis
Decision analysis with probabilities Typically, we use a tree diagram for the decision analysis. 1. A decision point is shown by a rectangle 2. Alternatives available at a decision point are shown as decision branches (DB). DB 3. At the end of each DB, there can be two or more chance events shown by a node and chance branches (CB). CB 20% 55% Decision point 25% Chance events must be mutually exclusive and exhaustive (total probability = 1). 4. At the end of each branch is an endpoint shown as a triangle where a payoff will be identified. DecisionAnalysis
Decision analysis with probabilities Decision point: Chance event : End point: DB: Decision Branch CB: Chance Branch At the chance node, we calculate the average (i.e. expected) payoff. The terminology used is Expected Monetary Value (EMV) DB CB If there is no chance event for a particular decision branch, it’s EMV is equal to the payoff. 20% 55% 25% We select the decision with the highest EMV . What if we are dealing with costs? DecisionAnalysis
A larger tree diagram DecisionAnalysis
Example 1 You bought 500 units of X @$10 each. A dealer has offered to buy these from you @$14 each ( you can make $4/unit profit). You can sell these yourself for $16 each ($6/unit profit) but the demand is uncertain. The demand distribution is shown in the table. Obviously, if demand exceeds 500, you will sell all 500. On the other hand, if demand is under 500, you will have leftover units. These leftover items can disposed off for $7 each ($3 loss, the dealer will no longer buy these leftover units from you). What’s your decision? DecisionAnalysis
Example 1 .. Suppose you have 500 units of X in stock, purchased for $10 each. Dealer sales price:$14, self sale price:$16 with salvage value:$7. Start with the tree having 2 branches (DB) at the decision point. There are no chance events in the dealer sale branch, Dealer Sale For the self sale, there are 4 mutually exclusive possibilities. 300, 30% Self sale 400, 45% 500, 20% 600, 5% DecisionAnalysis
Example 1 ... Suppose you have 500 units of X in stock, purchased for $10 each. Dealer sales price:$14, self sale price:$16 with salvage value:$7. EMV = 2000 Payoff = 500*4 = 2000 Dealer Sale Payoff = 300*6 – 200*3 = 1200 Payoff = 400*6 – 100*3 = 2100 300, 30% Payoff = 500*6 = 3000 Self sale 400, 45% 500, 20% Payoff = 500*6 = 3000 600, 5% EMV = 0.3*1200 + 0.45*2100 + 0.2* 3000 + 0.05*3000 = 2055 Your decision? DecisionAnalysis
Risk profile is the probability distribution for the payoff associated with a particular action. Risk Profile 300 30% Self Sale Payoff = 1200 400 45% 20% Payoff = 2100 500 5% Payoff = 3000 600 Payoff = 3000 • The risk profile shows all the possible economic outcomes and provides the probability of each: it is a probability distribution for the principal output of the model. DecisionAnalysis
Example 3 • We have received RFP (Request For Proposal). • We may not want to bid at all (our cost: 0) • If we bid, we will have to spend $5k for proposal preparation. Based on the information provided in the RFP, a quick decision is to bid either $115k or $120k or $125k. • We must select among 4 alternatives (including no bid). • A quick estimate of the cost of the project (in addition to the preparation cost) is $95k. • Looks like we may have a competitor. • If we bid the same amount as the competitor, we will get the project because of our reputation with the client. • We have gathered some probabilities based on past experience. DecisionAnalysis
Example 3.. All numbers in thousand dollars Our bid (OB) must be 0 (no bid), 115, 120 or 125. Competitor’s bid (CB): 0, under 115, 115 to under 120, 120 to under 125, 125 and over. Assumption: If bids are equal, we get the contract. Information : Preparation cost: $5 + Cost of work : $95 = $100 total Use mini-max, maxi-max, etc? There are probabilities involved. 0 0 0 0 0 15 -5 15 15 15 20 -5 -5 20 20 25 -5 -5 -5 25 DecisionAnalysis
Example 3… 1. There is a 30% probability that the competitor will not bid. 2. If the competitor does bid, there is (a) 20% probability of bid under $115. (b) 40% probability of bid $115 to under $120. (c) 30% probability of bid under $120 to under $125. (d) 10% probability of bid over $125. DecisionAnalysis
Example 3: Lose Win No bid $115 Payoff = (-5), Probability 14% $0 bid Payoff = 15, Probability 86% (-5)*(0.14) + 15 * (0.86) = $12.2 DecisionAnalysis
Example 3: L L L W W W Bid $115 Bid $120 Our decision? -5, 14% $0 $12.2 15, 86% Bid= $125 No bid $9.5 -5, 42% We will now use Excel to solve the problem. 20, 58% -5, 63% $6.1 25, 37% DecisionAnalysis
Ex. 3: Excel =SUMPRODUCT(Profit_bid_115,Probabilities) HLOOKUP ? INDEX+MATCH =MAX(D9:G9) Value we are looking (12.2) is not in the ascending order in the table. DecisionAnalysis
Example 3: Sensitivity analysis What if 30% probability of no bid from competitor is incorrect? We can build a one variable data table. Variable: Competitor’s no bid probability. We select two outputs: bid and (corresponding maximum) profit. DecisionAnalysis
Ex. 3: DA and value of information Our decision was to bid $115 and EMV was $12.2. Suppose we get competitor’s bid information. Can we improve our profit? 0.30 0.7 * 0.2 = 0.14 0.7 * 0.4 = 0.28 0.7 * 0.3 = 0.21 0.7 * 0.1 = 0.07 EMV = 0.3*25+0.14*0+0.28*15+0.21*20+0.07*25 = 17.65 Earned Value of Perfect Information (EVPI) = $17.65 – $12.2 = $5.45 Sometimes we may have partial information. DecisionAnalysis
Example 3: Alternate method CB=0 <115 30% 20% 115 to <120 -$5 40% 15(.3)+11(.7) = $12.2 $15 70% 30% $15 CB 120 to < 125 10% >125 $0 OB= $115 $15 No bid $15 $20 30% OB= $120 70% bid $5 Our decision $12.2 $9.5 -5(.2)+15(.4+.3+.1) = $11 OB= $125 30% $25 70% -$2 $6.1 EMV Payoff DecisionAnalysis
Example 3….. Values 12.2, 9.5 and 6.1 represent Expected Monetary Values (EMV). This line indicates the decision made. This is called folding back the decision tree. $12.2 $0 OB= $115 No bid $9.5 OB= $120 bid $12.2 OB= $125 $6.1 DecisionAnalysis
Utility theory • Different people will pay different amounts to play the first game • Expected payoff in the first game is $1 but most people do not want to play the game at all. • Why? Losing $100 is a bigger event than winning $102 • Most people will play the second game. • Still differ in how much they will pay. • Consider the gambling problems again. • Let us flip a fair coin once. • If you win I give you $102 • If I win, you give me $100 • How much will you pay me to play this game: $5, $2, $1, $0 ? • Consider another gamble • Let us flip the same coin (500 times) with the same payoffs • How much will you pay me to play this game? • For most people a gain that is twice as big is not twice as good. • A loss of twice as much is more than twice as bad. • People’s attitude towards risk can be categorized as: risk averse, risk seeker and risk neutral. • A common way to express it is through the decision-maker’s utility function. DecisionAnalysis
Utility is a measure of relative satisfaction. We can plot a graph of amount of money spent vs. “utility” on a 0 to 100 scale. Typical shapes for different types of risk takers generally follow the patterns shown below. Risk seeker Risk averse Risk neutral U(100) U(0) U(100) U(0) U(100) U(0) U(100) U(0) U(100) U(0) U(100) U(0) 0 100 0 100 0 100 0 100 0 100 0 100 Graphs above show that to achieve 50% utility, risk seekers will pay maximum, risk averse will pay minimum and risk neutral will pay an average amount. DecisionAnalysis