Correlational Studies
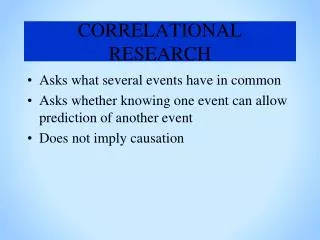
Correlational Studies. the presence of a correlation does not indicate a cause-effect relationship primarily a minimum of 30 participants is acceptable larger samples are used if validity and reliability are important. Types of correlation studies…. relationship studies….


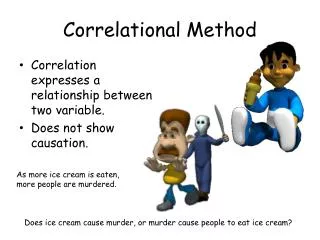
Correlational Studies
E N D
Presentation Transcript
the presence of a correlation does not indicate a cause-effect relationship primarily • a minimum of 30 participants is acceptable • larger samples are used if validity and reliability are important
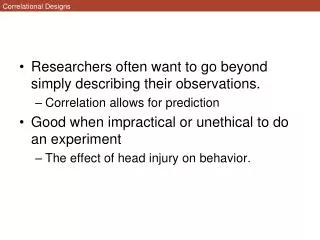
Types of correlation studies… • relationship studies… …attempt to gain insight into variables that are related to more complex variables • prediction studies… …conducted to test variables believed to be good predictors of a criterion
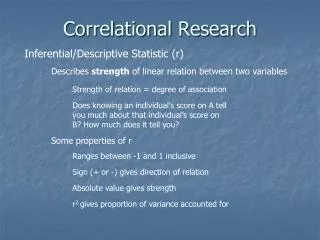
Data analysis and interpretation… …the two or more scores are obtained for each member of the sample, and the paired scores are then correlated …the correlation coefficient indicates the degree of relationship between the variables of interest
Correlation coefficient… -1.00 0.00 +1.00 strong positive strong negative no relationship
No correlation… y x
No correlation… y x
The method for computing a correlation coefficient… …depends upon the type of data represented by each variable …types of data: nominal (dichotomous) interval (continuous) ordinal (rank) ratio (continuous)
Measurement Scales • Nominal scales allow for only qualitative classification and have no arithmetic value. E.g. gender, race, color, city, etc • Ordinal scales allow us to rank order the items in terms of which has less and which has more but still they do not allow us to say "how much more." E.g. Likert scale, class rank, letter grade • Interval variables allow us not only to rank order the items that are measured, but also to quantify and compare the sizes of differences between them. E.g. temperature, test scores. • Ratio scales are like interval scales but they feature an identifiable absolute zero point, thus, they allow for statements such as x is two times more than y. E.g. age, height, weight. (Most statistical data analysis procedures do not distinguish between the interval and ratio scales).
with continuous data… …use the product moment correlation, Pearson r (ρ, rho) • with rank data… …use the rank difference correlation, Spearman r (ρ, rho)
with dichotomous data… …use the phi correlation (ψ) • with curvilinear data… …use the eta correlation (η)