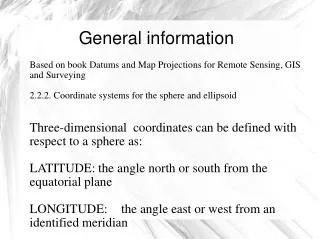
Statfjord - General Information Geography
130 likes | 366 Views
Fig. 1.7. Statfjord - General Information Geography. G3H. C2. OWC = 2597.0. C3. 9-5. C24. C10. C10A. 2700. C18. 9-4. 2600. C1. C4. C19A. C5A. C6. C14. C5. C11. C9. C12. SFC. C7. C19. C21. C11A. C15. C16. 2700. C25. C19B. C17. C22. 9-3. C27. C32. C28. C30.

Statfjord - General Information Geography
E N D
Presentation Transcript
Fig. 1.7 Statfjord - General InformationGeography
G3H C2 OWC = 2597.0 C3 9-5 C24 C10 C10A 2700 C18 9-4 2600 C1 C4 C19A C5A C6 C14 C5 C11 C9 C12 SFC C7 C19 C21 C11A C15 C16 2700 C25 C19B C17 C22 9-3 C27 C32 C28 C30 C36 C8 C18A C42A C33 C35 UK C20 C30A C13 C38 C12A C29 C26 9-9 C23T2 SFA A26 C12B 25 km C23B C31 C40A C42 C34 C39 C23A C37 A1 A6A C41 C40 2500 A4 A16A A11 A13 A8B OWC = 2586.3 A2 A13A A6 A2A A9 A8 A14 A7 A16 A8A A17 A15A A15 A27A A41A SFB A10 A22 A12 A11A&B A20A A23 A19 A37A 9-1 A18 A3A A3 A40A A25A A28 A42 A32 A27 A33 A25 A31 A31A A24 A30 A37 12-4 A23A A32A A29 A38A A41 B2A A40 B2 A35 A36 B1 A35A A39 12-2 B3 B8 B4 B5 B28C B11 B24A B38A B9 B12 2500 B18 B14 B28B B6B B7 B10 B39B B6A B2B B29 B17 B22A B15 B26 B21 B13 B22 B27 B32 B14A B16B B25 B10A B24 B23 B33 B31 B36 2500 B37 B30 B16A 24-1 B35A B19 B35 B34 B 23A B41 B39 4 km B42 B41A B38 B28A B28 B40 24-4 Fig. 1.8 Statfjord Field • Discovered 1974 • Start production 1979 • 280 wells incl. sidetracks • 124 active wells • 220 saturation logs • 340 production logs
Fig. 1.9 Statfjord – productionCumulative Oil Production STOOIP*) & Reserves *) STOOIP= Stock Tank Oil Originally In Place
Fig. 1.10 Statfjord – ProductionGas Utilization Performance History
Fig. 1.11 Statfjord – ProductionOil Production by Platform
-2400 -2900 West East -3400 0 1000 2000 3000 4000 Fig. 1.12 East West Cross Section Main Field East Flank Upper Brent Lower Brent Dunlin (Cook) Upper Statfjord Lower Statfjord
East Flank Attic -2400 -2900 West East -3400 0 1000 2000 3000 4000 Fig. 1.13 Remaining Reserves By-passed Undrained Cook Wedge zone
Fig. 1.14 URALIDENE 245 570 66 600 1.6 PANNOTIA CAMPANIAN 285 1000 RODINIA CRETACEOUS NORD ATLANTISK 24 APPALACHENE 360 SÖR ATLANTISK 144 408 SÖR INDISK KALEDONIDENE 163 37 MIDTRE ATLANTISK 2500 BRENT 438 DUNLIN STATFJORD 505 208 57 4000 240 66 570 245 PANGEA
Fig. 1.15 Middle Triassic (230 Ma)
Fig. 1.16 Early Jurassic (200 Ma)
Fig. 1.17 Middle Jurassic (170 Ma)
Fig. 1.18 Late Jurassic (145 Ma)