
Intercomparison of GOME, Ozonesonde, and SAGE-II Ozone Measurements
This study compares ozone data from GOME, ozonesonde, and SAGE-II instruments from 1996-1999. GOME generally agrees with SAGE-II but shows biases compared to ozonesonde data. Various biases are identified, emphasizing the need for standardization in ozonesonde datasets.

Intercomparison of GOME, Ozonesonde, and SAGE-II Ozone Measurements
E N D
Presentation Transcript
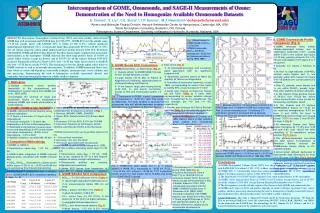
Intercomparison of GOME, Ozonesonde, and SAGE-II Measurements of Ozone: Demonstration of the Need to Homogenize Available Ozonesonde Datasets K. Chance1, X. Liu1 , C.E. Sioris1,2, T.P. Kurosu1, M.J. Newchurch3 (kchance@cfa.harvard.edu) 1Atomic and Molecular Physics Division, Harvard-Smithsonian Center for Astrophysics, Cambridge, MA, USA 2Sioris Atmospheric Consulting, Brampton, ON, Canada 3Atmospheric Science Department, University of Alabama in Huntsville, Huntsville, Alabama, USA A33B-0903 2005 Fall AbstractWe intercompare Stratospheric Column Ozone (SCO) and ozone profiles retrieved from GOME data with ozonesonde and SAGE-II data for 1996-1999. GOME SCO over the altitude range ~15-35 km usually agrees with SAGE-II SCO to within 2.5 DU (1.5%), without significant spatiotemporal dependence, but is systematically larger than ozonesonde SCO by 8-20 DU (5-10%) over all stations using the carbon iodine method and most stations between 30ºN-30ºS. Evaluation with SAGE-II, TOMS and Dobson data illustrates that those biases mainly originate from ozonesonde underestimates in the stratosphere. GOME retrievals also show large positive biases of 30-60% at carbon iodine stations (except for Syowa) and of 20-55% for all the stations between 30ºN-30ºS except for Paramaribo and Easter Island (<10%) over ~10-20 km, while biases relative to SAGE-II data over ~15-20 km are usually 10-20%. The discrepancies over this altitude region reflect biases in GOME retrievals as well as ozonesonde measurements. In addition, GOME/ozonesonde biases vary from station to station and depend on ozonesonde technique, instrument type, sensor solution, and data processing, demonstrating the need to homogenize available ozonesonde datasets and standardize future operational procedures for reliable satellite validation. m • 6. GOME/Ozonesonde Profile Comparison (Fig. 5) • GOME retrievals show similar altitude-dependent biases, due to radiometric calibration error: usually within 3 DU in the bottom two layers (~0-10 km), positive at layers 4-5 (~15-25 km), and negative from layers 6 or 7 on upward. • Absolute 1s mainly a function of lat. • At mid- to high-latitudes (>30ºN/S), relative mean biases and 1 are typically within 20% except for layers 3-4 (~10-20 km) over carbon iodine (CI) stations. • Over CI stations,mean biases and 1 are within 30-60%, usually larger than other stations at similar latitudes. • In the tropics, large positive biases of 20-55% over ~10-20 km, where ozone concentration is low except for Paramaribo and Easter Island • In the tropical and CI stations GOME/SAGE-II biases at ~15-25 km are relatively homogeneous: 0-5% for layer 5 and 8-20% for layer 4; GOME/sonde shows larger and varying biases: 5-20% for layer 5 and 20-55% for layer 4 (Fig. 6) • At American Samoa and Tahiti, biases increases by 11-15% over 0-25 km and 6-8% over ~25-35 km after switching to 2%-unbuffered sensor solution (Fig 5, row e). • The altitude-dependent correction and total ozone normalization at American Samoa reduces the GOME/sonde biases mainly in 2%-unbuffered data. • Uncorrected altitude hysteresis in ozonesonde data introduces an error of 5-15% over ~10-20km (Fig 5, row e) • Inhomogeneity exists in ozonesonde datasets, making it difficult to perform a reliable and consistent satellite validation without considering ozonesonde operational characteristics. Fig. 2 Mean biases for GOME/SAGE-II SCO4-7 (~15-35 km) GOME/ozonesonde SCO4-7 and SCO (tropopause-~30/35 km) at ozonesonde stations during 1996-1999. • 5. GOME/Sonde SCO Comparison • GOME/sonde SCO4-7 or SCO biases (Fig. 2) • Usually similar to GOME/SAGE-II biases at mid- to high-latitudes, except: • Large biases (10-15 DU) at Tateno & Kagoshima (CI stations), opposite biases at Hohenpeienberg and Payerne • In the tropics: large and varying biases (8-20 DU), 1, and poorer correlation, except at Hilo and Paramaribo (within 1-2 DU) • Time series (Fig. 3) • At Hohenpeienberg(a) and Lauder(e): good agreement with no significant temporal drift • Systematic positive biases at Naha (b), similarly at Tateno and Kagoshima • Transition at Ascension Island (c) in early 1998: corresponding to switch from EnSci to mostly SPC, a bias increase of 7.5 DU • Large bias change at American Samoa (d) and Tahiti (Table 2) in early 1998, corresponding to sensor solution change from 1%-bufferred to 2%-unbufferred. The bias changes are ~16 and ~11 DU, respectively. • Smaller bias changes (3-5 DU) at Boulder and Hilo (Table 2) due to altitude-dependent correction and total ozone normalization. • 1. Motivation • Validate retrieved ozone profiles (especially in the stratosphere) and stratospheric column ozone from GOME [Liu et al., 2005, JGR] • Investigate the sources of large and systematic biases in the stratosphere between GOME and sonde observations at some stations • Approach: GOME vs. ozonesonde/SAGE-II Fig. 3 Comparison of GOME, a priori, ozonesonde SCO (tropopause to ~30/35 km): (left) Time series. (b) differences. The black symbols in (d) show the ozonesonde data with altitude-dependent correction and total ozone normalization at American Samoa. Fig. 5. Absolute (columns 1-2) and relative (columns 3-4) mean biases and 1 between GOME and ozonesonde. Row (e) shows comparisons for 1%-buffered, 2%-unbuffered, and 200 m downward shift at American Samoa and Tahiti and corrected data at American Samoa. Fig. 1 Locations of ozonesonde stations • 2. GOME, Ozonesonde, SAGE-II • GOME: retrieved from UV spectra using optimal estimation • 11 layers (~5-km thick, 2-3 layers in the troposphere) • Vertical resolution: 7-12 km in the stratosphere, 9-16 km in the troposphere • Estimated uncertainties (random-noise errors and smoothing): 3-10% in the middle and upper stratosphere, 15-25% in the troposphere, ~1.2% in SCO • Spatial resolution: normally 96080 km2. • Ozonesonde: 33 stations as shown in Fig. 1 • Sources: WOUDC, CMDL, SHADOZ • Types: ECC, Carbon Iodine (CI), Brewer Mast (BM) • Precision: 3-5% for ECC, 5-15% for CI & BM • Accuracy: depends on techniques, sensor solution, ozonesonde model, and processing • SAGE-II (version 6.2): use O3 profiles down to 15 km • ~1 km vertical resolution • Accuracy: ~5% over 20-45 km • 10% mean agreement with ozonesonde measurements down to 15 km [Wang et al., 2002, JGR] • At Samoa, the bias change is reduced to 4 DU with a similar correction Table 2. Table 2. GOME/sonde SCO comp. at 4 CMDL stations before & after switching sensor solution from 1%-bufferred (blue) to 2%-unbuffered (red). • 3. Comparison Methodology • GOME vs. SAGE-II • Coincidence: same day, ±1.5º lat., ±5.0º lon. • SAGE-II data: integrated to GOME retrieval altitude grids, convolved with GOME retrieval AKs. • SCO4-7/SCO8-11: stratospheric column ozone within layers 4-7/8-11 or ~15-35 km/35-60 km are summed up from transformed profiles • GOME/SAGE-II comparison over a station: use all coincidences within ±5.0º lat., ±40.0º lon • GOME vs. ozonesonde • Use profiles extending above layer 6 (~30 km) • Coincidence: same day, ±1.5º lat, ±600 km in lon. (relaxed to 12º at a few tropical stations to obtain enough collocations) • Ozonesonde profiles are similarly integrated and convolved. • Sonde SCO (ozone from tropopause to layer 6/7 or ~30/35 km)/SCO4-7: similarly summed up. Fig. 6. Mean biases and 1 for comparisons of column ozone over GOME layer 4 (~15-20 km) and 5 (~20-25 km) between GOME and SAGE-II/sonde in 1996-May 1998. • Conclusions • GOME Stratospheric Column Ozone (SCO) over the altitude range ~15-35 km usually agrees with SAGE-II SCO to within 2.5 DU (1.5%) without significant spatiotemporal dependence. • GOME SCO is systematically larger than ozonesonde SCO by 8-20 DU (5-10%) over Carbon Iodine (CI) stations and most stations within 30ºN-30ºS. • The large biases of 10-20 DU mainly originates from sonde underestimates in the stratosphere. • GOME shows large positive biases of 30-60% over CI stations (except Syowa) and of 20-55% for all the stations in 30ºN-30ºS (except Eastern Island and Paramaribo) over 10-20 km • The discrepancies over this altitude regions reflect biases in both GOME and ozonesonde data. • GOME/sonde biases in SCO and profiles depends on sonde technique, instrument type, sensor solution, and data processing, demonstrating the need to homogenize available ozonesonde datasets and standardize future operational procedures for reliable satellite validation. AcknowledgementsThis study is supported by NASA and by the Smithsonian Institution. We thank the ESA for providing GOME level-1 data. We acknowledge WOUDC, NASA LRAB, SHADOZ, and CMDL for the ozonesonde and SAGE-II data. We acknowledge Dr. B.J. Johnson, Dr. S.J. Otlmans, and Dr. J.A. Logan for helpful discussion on the comparisons with ozonesondes. Fig. 4 GOME/other mean biases and 1 at 11 tropical stations in 98-99. SCO: tropopause to ~30/35 km; SCO4-7: ~15 to 35 km; ICO: surface to ~30/35 km; TCO: tropospheric column ozone; TO: total column ozone. Shaded area shows ±1 GOME/SAGE-II spread. • Comparison at 11 SHADOZ stations during 1998-1999 (Fig. 4). • Positive SCO biases from 4 DU(2.7%) to 16 DU(8-13%) at Ascension Island, Tahiti, American Samoa except at Paramaribo (-2 DU). • Similar biases in TCO + SCO • Generally consistent with the TOMS / SHADOZ biases seen in Thompson et al. [2003, JGR] • Usually consistent with TOMS, Dobson, and SAGE-II to within 3 DU. • Those large SCO biases of 10-16 DU, significant relative to 1 of various differences, mainly due to ozonesonde stratospheric underestimates. • 4. GOME/SAGE-II SCO Comparison • SCO8-11: -3–6 DU with poor correl. (Table 1): • wavelength-dependent calibration error • no measurements below 289 nm are used • SCO4-7: biases <2.5 DU (1.5%) (Table 1) • good correlation: 0.86-0.95 • 1: varies from 4.5 DU (2.4%) in the tropics to 12 DU (5.6%) at higher latitudes • negligible latitude dependence • SCO4-7: over ozonesonde stations (Fig. 2) • Mean biases: ±2.5 DU (1.5%) except over three Northern Europe Stations (- 6-7 DU). Table 1. GOME/SAGE-II SCO comparison statistics (#, mean, 1, R).


