Download
1 / 30
300 likes | 408 Views
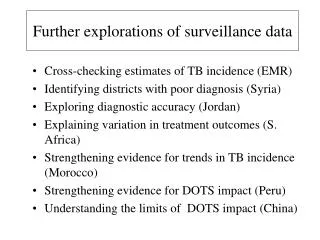
Further explore TB surveillance data standards and anomalies, cross-check TB estimates, identify poor diagnosis districts, explore diagnostic accuracy, understand treatment outcome variation, strengthen evidence on TB trends, norms and DOTS impact.

E N D
Further explorations of surveillance data • Cross-checking estimates of TB incidence (EMR) • Identifying districts with poor diagnosis (Syria) • Exploring diagnostic accuracy (Jordan) • Explaining variation in treatment outcomes (S. Africa) • Strengthening evidence for trends in TB incidence (Morocco) • Strengthening evidence for DOTS impact (Peru) • Understanding the limits of DOTS impact (China)
Standards and norms in TB epidemiology: 2 approaches 1. Comparisons with known standards e.g. • ss+ inc = 50 * ARTI (Styblo) • ss+/pulmonary cases = 70% • EP/all TB = 15-20% 2. Anomalies, deviations, and inconsistencies: • incidence inversely related to average age • regional variation in sex ratio • provincial differences in suspects/cases See indicator list
Smear-positive diagnosis by province, Syria 1.0 0.9 0.8 0.7 0.6 ss+/all pulmonary 0.5 0.4 0.3 0.2 0.1 0.0 A Ar D H I K L M OS Q R RD S SW T Z
TB suspects by province: Jordan 7000 6000 5000 4000 Suspects/100,000 population 3000 2000 1000 0 SALT IRBID MA'AN ZARKA KARAK AMMAN AQAUBA TAFILAH MAFRAQ MADABA
Compliance with treatment, Hlabisa, South Africa 1 0.9 treatment Probability of remaing on 0.8 Clinic Volunteer 0.7 CHW 0.6 0 15 30 45 60 75 90 105 120 135 150 165 180 Days
Compliance with short-course chemotherapy 1 0.9 proportion remaining 0.8 compliant 0.7 0.6 0.5 0 1 2 3 4 5 6 months Yougelson & Joubert, SAMJ 1991
Changing aetiology of tuberculosis Netherlands model, 45-49 yr-olds 160 140 progressive primary 120 100 exogenous reinfection Incidence rate/100K/year 80 endogenous reactivation 60 40 20 0 1950 1953 1956 1959 1962 1965 1968 1971 1974
Reward for diagnostic effort: Peru 0.04 0.03 0.02 Increase in notification rate/increase in smear exam rate 0.01 0 -0.01 92-93 93-94 94-95 95-96 96-97 97-98 98-99 Years compared
Source of retreatment patients Changshou County, China 70 60 n = 288 50 40 percentage 30 20 10 0 out of county in county, out in project project