When Intuition Differs from Relative Frequency
250 likes | 420 Views
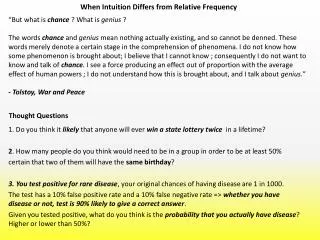
When Intuition Differs from Relative Frequency. Coincidences, Gamblers’ Fallacy, Confusion of the Inverse, Expected Values, and Simpson’s Paradox. A few questions to test your intuition:. What is the probability that at least two people in this class have the same birthday?

When Intuition Differs from Relative Frequency
E N D
Presentation Transcript
When Intuition Differs from Relative Frequency Coincidences, Gamblers’ Fallacy, Confusion of the Inverse, Expected Values, and Simpson’s Paradox
A few questions to test your intuition: What is the probability that at least two people in this class have the same birthday? Closer to 50% or 5%?
You test positive for rare disease. Your original chances of having disease are 1 in 100. The test is 80% accurate. Given that you tested positive, what do you think is the probability that you actually have the disease? Higher or lower than 50%?
If you were to flip a fair coin six times, which of the following sequences do you think would be most likely: HHHHHH or HHTHTH or HHHTTT?
Which one would you choose in each set? (Choose either A or B and either C or D.) A. A gift of $240, guaranteed B. A 25% chance to win $1000 and a 75% chance of getting nothing C. A sure loss of $740 D. A 75% chance to lose $1000 and a 25% chance to lose nothing
Is it possible that a cause of death could rank at or near the top of the list for almost all age groups, but not near the top of the list for the entire population?
Sharing the Same Birthday What is the probability that at leasttwo people in this class have the same birthday? Most people think that the probability is small but it is actually close to 50%. Most are thinking about the probability that someone will have their birthday which is much more unlikely.
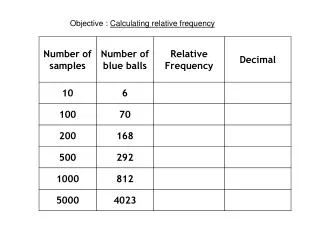
Sharing the Same Birthday What is the probability that at least two people in this class have the same birthday? First find the probability that no one in the class has the same birthday then subtract from 1. Probability that none of the 27 people share a birthday: (365)(364)(363) · · · (341)(340)(339)/(365)27 = 0.37314 Probability at least 2 people share a birthday: 1–.37314 =.62686 So the probability that 2 people in the class share the same birthday is actually close to 63%!
Most Coincidences Only Seem Improbable • Coincidences seem improbable only if we consider the probability of thatspecific eventoccurring at that specific time to us. • If we consider the probability of it occurring some time, to someone, the probability can become quite large. • Since there are a multitude of experiences we have each day, it is not surprising that some may appear improbable.
More Likely Coin Flip Outcome If you were to flip a fair coin six times, which sequence do you think would be most likely: HHHHHH or HHTHTH or HHHTTT? People regard the sequence HTHTTH to be more likely than the sequence HHHTTT, which does not appear to be random, and also more likely than HHHHTH, which does not seem to represent the fairness of the coin. However, each of the above sequences is equally likely. What is the probability of each sequence? Each has a probability of (.5)6 which is .015625.
The Gambler’s Fallacy Gambler’s Fallacy is the mistaken notion that the chances of something with a fixed probability increase or decrease depending upon recent occurrences. People think the long-run frequency of an event should apply even in the short run. Remember: Independent Chance Events Have No “Memory” People tend to believe that a string of good luck will follow a string of bad luck in a casino. or People tend to believe that a “streak” will continue. However, winning or losing ten gambles in a row doesn’t change the probability that the next gamble will be a win or a loss.
The Gambler’s Fallacy When It May Not Apply Gambler’s fallacy applies to independent events (one in which the outcome of one event does not affect the next). It may not apply to situations where knowledge of one outcome affects probabilities of the next. Example: In card games using a single deck, knowledge of what cards have already been played provides information about what cards are likely to be played next.
Confusion of the Inverse Malignant or Benign? • Patient has a lump. In about 1% of cases, the lump is malignant. • Mammograms are 80% accurate for malignant lumps and 90% accurate for benign lumps. • Mammogram indicates lump is malignant. • What are the chances the someone with a lump that tests positive for malignancy really has malignant lump? • In study, most physicians said about 75%, do you agree? • Create a table in Excel in order to calculate the chance that a patient with a positive test result does actually have a malignant tumor.
Confusion of the Inverse The other 20% have negative test results even though they have cancer. The other 10% get positive test results in which the mammogram incorrectly suggests their tumors are malignant. Mammogram screening correctly identifies 80% of the 100 tumors as malignant. Mammogram screening correctly identifies 90% of the 9900 tumors as benign. • Let’s consider a study in which mammograms are given to 10,000 women with breast tumors. • Recall that in 1% of cases the tumor is malignant. (.01)*(10,000) = 100 women with cancer 80 True positives 990 False positives 8910 True negatives 20 False negatives
Confusion of the Inverse Now we compute the row totals. 80 True positives 1070 990 False negatives 8930 8910 True negatives 20 False positives
Confusion of the Inverse According to the numbers in the table, percent of positive tests who were actually malignant is: 80/1,070 = 0.075. In study, most physicians said about 75%, but it is only 7.5%! The physicians were off by a factor of 10! Confusion of the Inverse: Physicians were confusing the probability of getting a positive test if you do have cancer with the probability of having cancer if you get a positive test.
Confusion of the Inverse The Probability of a False Positive Test If base rate for disease is very low and test for disease is less than perfect, there will be a relatively high probability that a positive test result is a false positive. The false positive rate for our example is 9900/10700 or 92.5% To determine probability of a positive test result being accurate, you need: 1. Base rate or probability that you are likely to have disease, without any knowledge of your test results. 2. Sensitivity of the test – the proportion of people who correctly test positive when they actually have the disease 3. Specificity of the test – the proportion of people who correctly test negative when they don’t have the disease
Using Expected Values To Make Wise Decisions Revisit the question from earlier: If you were faced with the following alternatives, which would you choose? Note that you can choose either A or B and either C or D. A. A gift of $240, guaranteed B. A 25% chance to win $1000 and a 75% chance of getting nothing C. A sure loss of $740 D. A 75% chance to lose $1000 and a 25% chance to lose nothing
Using Expected Values To Make Wise Decisions A. A gift of $240, guaranteed B. A 25% chance to win $1000 and a 75% chance of getting nothing A versus B: majority chose sure gain A. Expected value under choice B is $250, higher than sure gain of $240 in A, yet people prefer A. To calculate the expected value multiply the probability and the amount then add the values: (.25)(1000) + (.75)(0) = $250
Using Expected Values To Make Wise Decisions C. A sure loss of $740 D. A 75% chance to lose $1000 and a 25% chance to lose nothing C versus D: majority chose D-gamble rather than sure loss. Expected value under D is $750, a larger expected loss than $740 in C. (.75)(-1000) + (.25)(0) = -750 People value sure gain, but willing to take risk to prevent loss.
Using Expected Values To Make Wise Decisions If you were faced with the following alternatives, which would you choose? Note that you can choose either A or B and either C or D. A: A 1 in 1000 chance of winning $5000 B: A sure gain of $5 C: A 1 in 1000 chance of losing $5000 D: A sure loss of $5 • Would you make the same decisions as you did in the previous example? Why or why not? • What is the Expected Value for each option?
Using Expected Values To Make Wise Decisions For A and B, the EV is $5 For C and D, the EV is -$5 • A versus B: 75% chose A (gamble). Similar to decision to buy a lottery ticket, where sure gain is keeping $5 rather than buying a ticket. • C versus D: 80% chose D (sure loss). Similar to success of insurance industry. Dollar amounts are important: sure loss of $5 easy to absorb, while risk of losing $5000 may be equivalent to risk of bankruptcy.
Simpson’s Paradox Is it possible that a cause of death could rank at or near the top of the list for almost all age groups, but not near the top of the list for the entire population? ‘Simpson’s Paradox refers to the reversal of the direction of a comparison or an association when data from several groups are combined to form a single group’
Simpson’s Paradox How can death from car accident be at or near the top of the list for most age groups, but 5th for all ages? The numbers don’t seem to “work” but they do. Let’s take a look at the Excel file for Leading Causes of Death.
Simpson’s Paradox How can death from car accident be at or near the top of the list for most age groups, but 5th for all ages? Each age group is not equally represented in the overall number of deaths. As expected, the number of deaths in the older age groups is much higher than in the younger age groups. Since MV Traffic Crashes was not even in the top 10 for causes of death for ages 65 and over, it “pulls down” MV Traffic crashes when comparing causes for all age groups.