Download
1 / 15
150 likes | 409 Views
Learn about the various factors affecting computer system performance, such as technology, processors, memory, and software. Discover metrics, execution time, CPI, and performance measures like MIPS and MFLOPS.

E N D
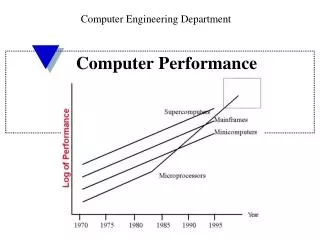
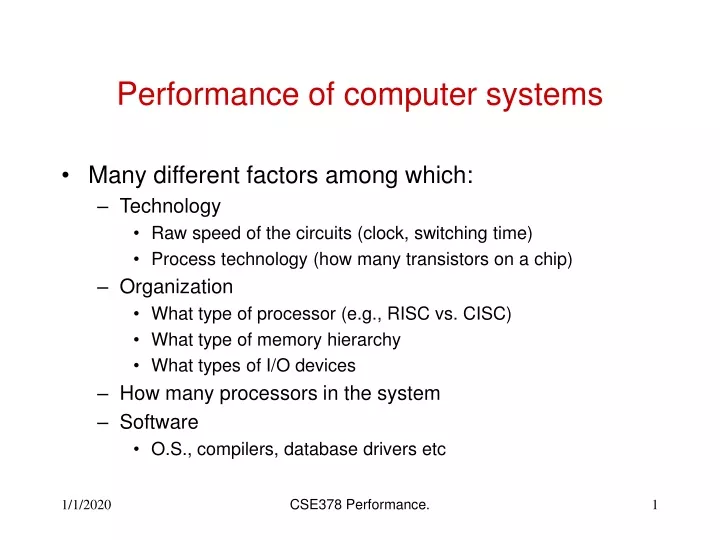
Performance of computer systems • Many different factors among which: • Technology • Raw speed of the circuits (clock, switching time) • Process technology (how many transistors on a chip) • Organization • What type of processor (e.g., RISC vs. CISC) • What type of memory hierarchy • What types of I/O devices • How many processors in the system • Software • O.S., compilers, database drivers etc CSE378 Performance.
Moore’s Law Courtesy Intel Corp. CSE378 Performance.
Processor-Memory Performance Gap • x Memory latency decrease (10x over 8 years but densities have increased 100x over the same period) • o x86 CPU speed (100x over 10 years) Pentium IV 1000 o Pentium III o Pentium Pro o “Memory wall” Pentium 100 o o “Memory gap” 386 x x x x x x 10 1 89 91 93 95 97 99 01 CSE378 Performance.
What are some possible metrics • Raw speed (peak performance = clock rate) • Execution time (or response time): time to execute one (suite of) program from beginning to end. • Need benchmarks for integer dominated programs, scientific, graphical interfaces, multimedia tasks, desktop apps, utilities etc. • Throughput(total amount of work in a given time) • measures utilization of resources (good metric when many users: e.g., large data base queries, Web servers) • Quite often improving execution time will improve throughput and vice-versa CSE378 Performance.
Execution time Metric • Execution time: inverse of performance Performance A = 1 / (Execution_time A) • Processor A is faster than Processor B Execution_time A < Execution_time B Performance A > Performance B • Relative performance PerformanceA / PerformanceB =Execution_timeB / Execution_timeA CSE378 Performance.
Measuring execution time • Wall clock, response time, elapsed time • Some systems have a “time” function • Unix 13.7u 23.6s 18:37 3% 2069+1821k 13+24io 62pf+0w • Difficult to make comparisons from one system to another because of too many factors • Remainder of this lecture: CPUexecution time • Of interest to microprocessors vendors and designers CSE378 Performance.
Definition of CPU execution time CPU execution_time = CPU clock_cycles*clock cycle_time • CPU clock_cycles is program dependent thus CPU execution_time is program dependent • clock cycle_time (nanoseconds, ns) depends on theparticular processor • clock cycle_time = 1/ clock cycle_rate (rate in MHz) • clock cycle_time = 1s, clock cycle_rate= 1 MHz • clock cycle_time = 1ns, clock cycle_rate= 1 GHz • Alternate definition CPU execution_time = CPU clock_cycles / clock cycle_rate CSE378 Performance.
CPI -- Cycles per instruction • Definition: CPI average number of clock cycles per instr. CPU clock_cycles = Number of instr. * CPI CPU exec_time = Number of instr. * CPI *clock cycle_time • Computer architectstry to minimize CPI • or maximize its inverse IPC: number of instructions per cycle • CPI in isolation is not a measure of performance • program dependent, compiler dependent • but good for assessing architectural enhancements (experiments with same programs and compilers) • In an ideal pipelined processor (to be seen soon) CPI =1 • but… not ideal so CPI > 1 • could have CPI <1 if several instructions execute in parallel (superscalar processors) CSE378 Performance.
Classes of instructions • Some classes of instr. take longer to execute than others • e.g., floating-point operations take longer than integer operations • Assign CPI’s per classes of inst., say CPIi CPU exec_time = (CPIi*Ci)* clock cycle_time where Ci is the number of insts. of class i that have been executed • Note that minimizing the number of instructions does not necessarily improve execution time • Improving one part of the architecture can improve the CPI of one class of instructions • One often talks about the contribution to the CPI of a class of instructions CSE378 Performance.
How to measure the average CPI A given of the processor Elapsed time: wall clock CPU exec_time = Number of instr. * CPI *clock cycle_time • Count instructions executed in each class • Needs a simulator • interprets every instruction and counts their number • or a profiler • discover the most often used parts of the program and instruments only those • or use sampling • Use of programmable hardware counters • modern microprocessors have this feature but it’s limited CSE378 Performance.
Other popular performance measures: MIPS • MIPS (Millions of instructions per second) MIPS = Instruction count / (Exec.time * 106) MIPS = (Instr. count * clock rate)/(Instr. count *CPI * 106) MIPS = clock rate /(CPI * 106) • MIPS is a rate: the higher the better • MIPS in isolation no better than CPI in isolation • Program and/or compiler dependent • Does not take the instruction set into account • can give “wrong” comparative results CSE378 Performance.
Other metric: MFLOPS • Similar to MIPS in spirit • Used for scientific programs/machines • MFLOPS: million of floating-point ops/second CSE378 Performance.
Benchmarks • Benchmark: workload representative of what a system will be used for • Industry benchmarks • SPECint and SPECfp industry benchmarks updated every few years, Currently SPEC CPU2000 • Linpack (Lapack), NASA kernel: scientific benchmarks • TPC-A, TPC-B, TPC-C and TPC-D used for databases and data mining • Other specialized benchmarks (Olden for list processing, Specweb, SPEC JVM98 etc…) • Benchmarks for desktop applications, web applications are not as standard • Beware! Compilers are super optimized for the benchmarks CSE378 Performance.
How to report (benchmark) performance • If you measure execution times use arithmetic mean • e.g., for n benchmarks (exec_timei) / n • If you measure rates use harmonic mean n/ ( 1/ratei) = 1/(arithmetic mean) CSE378 Performance.
Computer design: Make the common case fast • Amdahl’s law (speedup) • Speedup = (performance with enhancement)/(performance base case) Or equivalently, Speedup = (exec.time base case)/(exec.time with enhancement) • For example, application to parallel processing • s fraction of program that is sequential • Speedup S is at most 1/s • That is if 20% of your program is sequential the maximum speedup with an infinite number of processors is at most 5 CSE378 Performance.