Scaling Network Emulation Using Topology Replication
Explore ModelNet, Scalability, Replication in network emulation using pipe models, flows, and challenges of synchronization for scalability. Evaluate correctness, distributions, and future work.

Scaling Network Emulation Using Topology Replication
E N D
Presentation Transcript
Scaling Network Emulation Using Topology Replication Second Year Project Advisor : Amin Vahdat Committee: Jeff Chase, Jun Yang
Outline • ModelNet • Scalability • Replication • Motivation • Theory • Evalution • Conclusions and Future Work
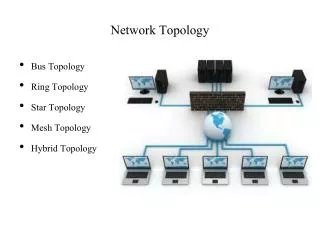
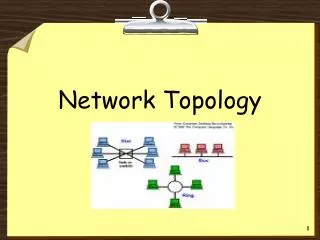
Model network links as pipes Pipe is a queue Bandwidth, loss rate, latency,queuing discipline etc. Multiple flows share the same pipe(capture congestion) ModelNet
Replication • Emulation capacity limited by the core • For a fixed topology measured in terms of packets per second processed • Need more processors to scale • Key observation: Not one flow is responsible for the breakdown but a lot of them collectively • Intuition: Somehow let different processors handle different flows. • The challenge: How to synchronise so that the processor in unison emulate the behaviour expected
State diagram for a pipe Backoff / Set timer, bw=bw * b FREE CONSTRAINED Timeout / Reset bw = bw_max State diagram for a pipe
Evaluation • Long Lived Flows • Short Web like flows What to measure ? • Correctness/Accuracy • Overhead
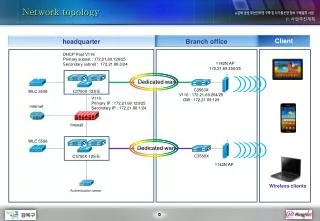
Web like flows Client Client
How to measure correctness • Measure file access times for 10 files each from 10 clients • Network measurement=> large variance in results=> use Statistics • Perform the test a large number of times(>30)=> 100 distributions • Repeat with replication on=>100 distributions • Compare pairwise=> 100 comparisons • What does comparison mean?
Comparing Distributions • Kolmogorov-Smirnov Test (KStest) • Null Hypothesis=> CDFa=CDFb • Set significance level =0.05 • Unable to reject null hypothesis-> with large confidence CDFa=CDFb • Results => unable to detect for 90 pairs(90%)
Comparing Distributions • For at least 90% the cdfs seem to match.(Null hypothesis not rejected) • For remaining 10 % • Compare 90-ile of bandwidths seen • Calculating percentage deviation of cfm compared to logical pipe • [Plot/quote error in throughput for these cases] • Other ways?
Q-Q plot • A straight line here means that both samples are drawn from the same underlying distribution
Percentage error for 90-iles • The cdf is good if the 90-ile has a low percentage error
Scalability • Havent gone into this at all. Scaling with more number of cores? • [possibly graph showing more pps when the partitioning case has a lot of cross-traffic]
Overhead • Have a loose bound on the communication overhead which does not seem bad but more can be future work
Conclusions and Future Work • Showed replication as an effective technique to scale. • Parameters are application specific but more work required to quanitfy their roles. • Partitioning along with replication should be considered • A more realistic application evaluated
Thanks! Questions?