INFO ASSIST REPORT WRITING
630 likes | 852 Views
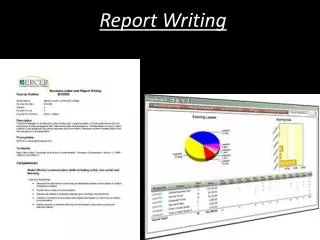
INFO ASSIST REPORT WRITING. AN INTRODUCTION TO USING AND BUILDING REPORTS USING INFOASSIST. Course Outline. Module 1: Most Important Part of Reporting Module 2: WebFOCUS Components Module 3: Introduction to INFO ASSIST Module 4: Using Filters Module 5: Using Prompts Module 6: JOINS

INFO ASSIST REPORT WRITING
E N D
Presentation Transcript
INFO ASSIST REPORT WRITING AN INTRODUCTION TO USING AND BUILDING REPORTS USING INFOASSIST
Course Outline • Module 1: Most Important Part of Reporting • Module 2: WebFOCUS Components • Module 3: Introduction to INFO ASSIST • Module 4: Using Filters • Module 5: Using Prompts • Module 6: JOINS • Module 7: Using DEFINE and COMPUTE • Module 8: Functions • Module 9: Customizing and Styling a report • Module 10: Creating an INFO MINI Application • Module 11: Creating a Compound Document • Module 12: Charting
Module 1Know Your Data • ODS Reporting View Meta Data Reports https://banneraux.appstate.edu:9013/metadata/ODS_index.html • Dynamic Help on the Banner Form
Module 3Introduction to INFO ASSIST • With INFO ASSIST you can quickly and easily 1. Create highly complex reports, charts and documents without IT intervention. 2. Complete building a report with minimal clicks. 3. Publish and Share documents 4. Convert Reports to Charts and Charts to Reports 5. Output report data in a variety of formats
Accessing INFO ASSIST • http://wfclientmre-test.appstate.edu:8080/ibi_apps/bid-login?
Exercise 3.1 • In this exercise you will create your first report using InfoAssist.
Sorting • Sorting enables you to display the report information grouped in a particular order. This way information can be organized by rows or columns. • InfoAssist Sorting options include: • BY—for sorting rows • ACROSS—for sorting columns. • BY and ACROSS together—for creating a cross tabulation report.
Exercise 3.2 • Sorting your report • Page Headings and Footings • Change a column heading
Exercise 3.3 • Sorting • Summing • Across
Module 4: Using Filters • Testing for NULL values • Testing for a range of values • Testing for certain values in a field.
3 Phases of Processing a Selection Phase 1 – Analyze and Parse the request. Phase 2 – Build the internal table a. Selection of real data b. Selection of virtual fields Phase 3 – Process the internal table
Masking in Filters • Filters can accommodate the use of a masking character ($) accompanied by a wildcard (*) when performing a selection on part of an alpha numeric field.
Compound Filters • The filter statement supports the use of compound nested conditions • A single filter can be comprised of multiple values.
Numeric Field Selection • Selection can be performed on numeric fields • Minus sign and decimal point are allowed • Don’t use a dollar sign or a comma • Do not use LIKE or NOT LIKE • Only a single value may be specified when using: > greater than >= greater than or equal < less than <= less than or equal
Exercises Module 4 • Exercise 4.1 – create a simple filter • Exercise 4.2 – Using masking in a filter • Exercise 4.3 – Compound filters • Exercise 4.4 – Numeric filters
Module 5Using PROMPTS • Dynamic • Static • Simple
Module 6:JOINS • A JOIN is a temporary virtual connection between two or more physical data sources that share at least one common field.
Types of JOINS • Single • Left Outer
SARADAP SPRIDEN
SARADAP SPRIDEN
JOIN Exercises • Exercise 6.1 - Single Inner JOIN • Exercise 6.2 – Left Outer JOIN
Module 7:Using DEFINE and COMPUTE • Virtual Field (DEFINE) • Calculated Field (COMPUTE)
The DEFINE Tool • This tool provides a graphical way in which temporary fields (DEFINES) can be created for use in reports. • Located on the data tab in InfoAssist
Exercise 7.1 • Create a DEFINE field
COMPUTE • Evaluated at the report level after all data is retrieved, summed, and sorted. • Created within the report itself and automatically listed as a column in the report. • It CANNOT be used as a primary sort field.
Exercise 7.2 • Create a COMPUTE field
EDIT • The EDIT Function is used to change the way a Fields values are displayed in a report. • Used to extract characters from or add characters to an alpha field Syntax – EDIT(fieldname, ‘mask’)
HDATE • Converts the format of a date time field to MDYY • Syntax: HDATE(value, ‘MDYY’, outfield)
SUBSTR • Extracts a substring from a character string by position. • Syntax: SUBSTR(inlength, parent, start, end, sublength, outfield)
HGETC • Stores the current date and time in a date-time field. • Syntax: HGETC(length, outfield)
Functions Exercises • Exercise 8.1 – An example of EDIT • Exercise 8.2 – An example of HDATE • Exercise 8.3 – An example of SUBSTR • Exercise 8.4 – An example of HGETC
Module 9Customizing and Styling • Excel Output for Reports • Styling Reports • Using Custom Reporting Features • Creating Customized Report Outputs
Excel Formats Available • Excel 2007 • Excel 2000 • Excel Formula • Excel Pivot
Styling a report • Global Styling • Style of Data and Column Fields • Style Headings and Footings • Style rows of data with alternating colors • Apply traffic light conditional styling to data • Increase or decrease amount of space inserted between rows and columns.
Custom Reporting Features • Rank • Limit the variables of a column in a report • Add page and line breaks • Add subtotals • Add column totals • Add row totals • Add subheadings and subfootings • Pop-Up titles • Add data visualization
Customized Report Outputs • Table of Contents • Freeze Column titles in a report • Create pages on Demand reports
Styling Exercises • Exercise 9.1 – Excel outputs • Exercise 9.2 – Styling, headings and footings. • Exercise 9.3 – Rank, Line breaks, Pop-up Titles. • Exercise 9.4 – Table of Contents, freezing columns, page on demand