Political Analysis
70 likes | 493 Views
This course introduces statistical tools for organizing and interpreting data in scientific analysis. Learn about descriptive and inferential statistics, computing averages, and using SPSS software for data analysis.

Political Analysis
E N D
Presentation Transcript
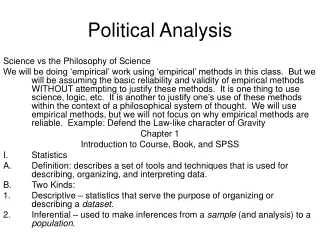
Political Analysis Science vs the Philosophy of Science We will be doing ‘empirical’ work using ‘empirical’ methods in this class. But we will be assuming the basic reliability and validity of empirical methods WITHOUT attempting to justify these methods. It is one thing to use science, logic, etc. It is another to justify one’s use of these methods within the context of a philosophical system of thought. We will use empirical methods, but we will not focus on why empirical methods are reliable. Example: Defend the Law-like character of Gravity Chapter 1 Introduction to Course, Book, and SPSS • Statistics • Definition: describes a set of tools and techniques that is used for describing, organizing, and interpreting data. • Two Kinds: • Descriptive – statistics that serve the purpose of organizing or describing a dataset. • Inferential – used to make inferences from a sample (and analysis) to a population.
Why take/know statistics? • Sets you apart from “common” students in your field (resume boost). • Adds rigor and teeth to any argument. • Enhances ability to read and think critically, especially of information in the media. • Preps you for graduate studies in most fields. • Course Tips (12-13). • SPSS • Opening program and data files • Variable view and Data View • Cases, Variables, Data entry and Coding • Play with it!!!!!!
Chapter 2 Computing and Understanding Averages • Averages or measures of central tendency – describes a dataset. • Three kinds: mean, median, mode. • Mean: most common. Sum all the values in a group, divide by the total number of values in that group (Hint: start listing them in columns/headings).
Weighted Mean (symbol=Med): Multiply each value by its frequency. Sum. Divide by total frequency. • Median: the mean is very sensitive to outlier scores that skew the distribution; median is not. It is the midpoint value. Instructions: order all values. Find the middle-most score. That’s the median (if even number of cases, find middle-most two values; add them, divide by two). Percentiles: 50th percentile is the median. 75th percentile means score is at or above 75% of the other scores. 3. Mode: most frequent value.
When to use what. • Three kinds of data • Nominal – categorical data (race, region). • Ordinal – values are ranked, but not necessarily equal in distance (7 values indicating GOP support). • Interval – values are equal in distance (income). • Use mean for interval (and sometimes ordinal). Use mode for nominal (and sometimes ordinal). Use median for interval if you think there are outliers. C. Using SPSS to compute mean, median, mode, and frequencies.