Download
1 / 154
1.55k likes | 1.57k Views
Understand big data myths, collection methods, and decision-making implications. Explore the benefits, challenges, and sobering truths of big data analytics with statistical insights.

E N D
PDI Data Literacy: Busting Myths of Big Data Nairanjana (Jan) Dasgupta Professor, Dept. of Math and Stats Boeing Distinguished Professor of Math and Science Director, Center of Interdisciplinary Statistics Education and Research (CISER)Washington State University, Pullman, WA Email:dasgupta@wsu.edu
Part 1: Data in general • Data: Big or Small • SOURCE of data • Types of Data • Population versus Sample • Experiment versus observational studies • Exploratory and Confirmatory studies
Part 2: making sense of data • Distinction: Uni-variate, Bi-variate, Multi-variate, multiple • Graphical Summary of data • Numerical summary of data • Measures of Center • Measures of Spread • Measures of the Dimensionality • Summarizing multivariate data sets using clusters • Population versus sample what do we have data on?
Part 3: Making decisions from data: • Going from sample to population • Inference and decision making • Estimation and Intervals • Testing and Confidence Intervals • Errors in testing: Type I and Type II • Power • Statistical significance • P-value — good, bad or misused • ASA’s statement about p-values
Part 4: Big Data and its pros and cons • What are the advantages of big data • What do we mean by big? Big n or big p • Decision making with big data • Predictive analytics • Back to population versus sample • Overview and recap
Part 1:Data and its collection Types of Data: The good the bad and the ugly
Statistics and Data • Statistics has been often defined as the Science (or art) of collecting, compiling, summarizing, analyzing and inferring from data. • By this definition: it is the science (or art) that is meant to deal with data • So what is data science? The science dealing with big data?
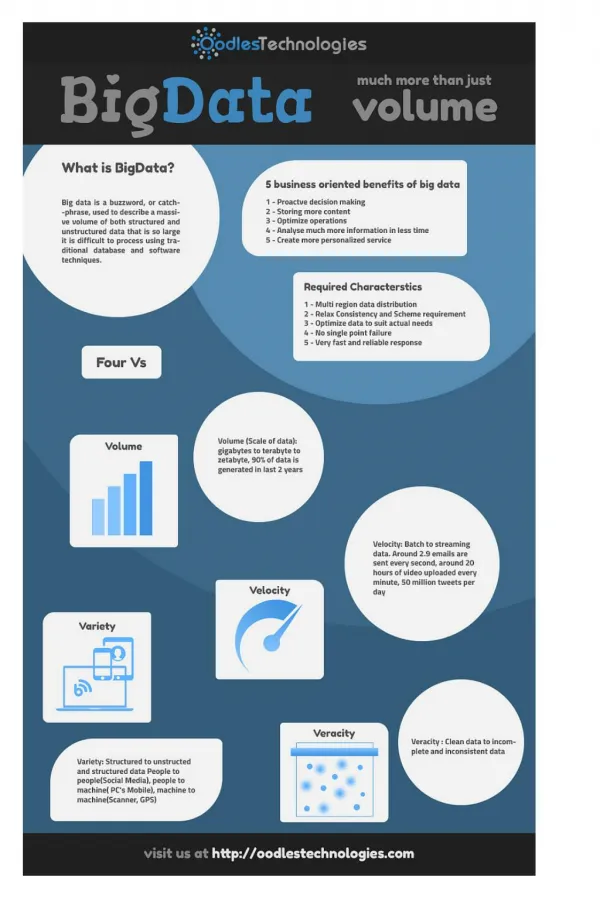
BIG Data? • What is big data? • How big is big? • Is it necessarily a good thing? • Some thoughts about how we deal with it from the Statistics point of view • We will start and end on this topic • But focus in the middle for the most part of “good” data
Some facts about BIG data • Most of the time big data is generated not collected. • No study design associated with its collection • Often unclear what we want it to tell us: we are often doing a stab in the dark approach. • I would like to coin the phase “opportunistic data” for big data that is not collected with a specific aim in mind, like social media data or phone data.
BIG Data: Some thoughts • Not much ACTUAL data analysis as the challenge is to actually manage and extract. • Mostly pretty pictures and “dashboards’ • An obsession now with decision makers: a buzzword. • Having more doesn’t solve the problem if the data is not “GOOD” to start off with. • Has more problems with BIAS as it is not collected in a systematic way. • Issues with dimensionality. • Extreme problems of multiple testing and false positives
Sobering Thoughts: Some Findings from BIG data that didn’t gel: • Prediction of flu outbreaks was off by a factor of 2 • Academy Award predictions were more off than correct • For the 2016 election Forbes predicted "If you believe in Big Data analytics, it’s time to begin planning for a Hillary Clinton presidency and all that entails.” • Many other examples…
Data: GOOD, BAD or the culprit? • I will misquote Samuel Taylor Coleridge here (his quote was about water), when the ancient mariner was stuck in the middle of the ocean: Data data everywhere, and it really makes us blink Data, data everywhere but we’ve got to stop and think… • This is the theme of today’s lecture: understanding data, types of data and what we can and cannot do with data. The Mathematics/Statistics that we need to understand to deal with data…
How can data be used? • Just because we have data does it mean we know something? • Can we say anything at an individual level? • I want to go to WH Auden and address this question…
THE UNKNOWN CITIZENBY W. H. AUDEN(To JS/07 M 378This Marble MonumentIsErected by the State) He was found by the Bureau of Statistics to be One against whom there was no official complaint, And all the reports on his conduct agree That, in the modern sense of an old-fashioned word, he was a saint, For in everything he did he served the Greater Community. Except for the War till the day he retired He worked in a factory and never got fired, But satisfied his employers, Fudge Motors Inc. Yet he wasn't a scab or odd in his views, For his Union reports that he paid his dues, (Our report on his Union shows it was sound) And our Social Psychology workers found That he was popular with his mates and liked a drink. …
Unknown Soldier… Contd … He was married and added five children to the population, Which our Eugenist says was the right number for a parent of his generation. And our teachers report that he never interfered with their education. Was he free? Was he happy? The question is absurd: Had anything been wrong, we should certainly have heard. From Another Time by W. H. Auden.
Data collected because or just because • There is a distinction whether we are collecting data with a specific object in mind or we are using existing data that is already available. • Even a few years ago data was expensive and valuable and collected mostly with specific objects in mind • Now, there is a deluge in terms of data that is available for use as it is being collected ANYWAY.
Let us start with collecting some data • Let us start with some information about you: • What is your department or unit? • How many Statistics classes you have taken? • On a scale of 1 to 5 rate your liking for Statistics • Your average blood pressure when faced with a Stats problem There is no source that I know of where such data is available so let us physically collect it.
Types of data Ordinal
What are these? • Nominal: Name, category • Discrete: what you count • Continuous: what you measure • Ordinal is in some no-man’s land mostly categorical but with a numerical flavor. • What is your unit? • On a scale of 1 to 5 rate your liking for Stats • How many Statistics classes you have taken? • Your blood pressure when faced with a Stats problem
How to collect this data? • Questions 1-3 are self reported easily. • How about question 4? • Let us think about that
The big question is: WHY did I collect this information? • The reason we collected this information was to get some idea about all of you so I could come up with a plan of what to talk about, how much detail I go into etc. • So, the idea is I take the data I collected and LEARN something from this data? • Data by itself is just a bunch of numbers or categories and by itself it doesn’t mean much. • What we need to do is figure out how we LEARN from data.
Why collect Data? • In the past to answer a specific question or questions. • However, nowadays SOME data is collected without a specific object in mind, just because everything is data oriented, and collection is easy, internet, cell phone, credit card, Department stores etc. • But in general we have a purpose for collecting data, a specific questions or questions. • We want to learn something that we do not know from data.
Population versus Sample • Our question of interest is almost always about the big picture: something hard to study, but knowing would help us make decisions. • Population: Sum total of all individuals and objects in a study • Sample: part of the population selected for the study • Idea: Get a good sample, study this sample carefully and infer about the population based on the sample. • The data I just collected is this a population or a sample?
Where does statistical science come in? • If we could always study the population directly: we wouldn’t need Statisticians except for clerical jobs like summarizing… • If we are relying on samples: we need to take a GOOD sample: the good is defined by Statistics • What type of sample can I take? • How exactly can I “infer” attributes about the population (parameter) based on a sample (statistic)? • Caveat: the population at hand needs to be a REAL representative population.
Experiments versus Observational Studies • Experiments: You change the environment to see the effect your change had, trying to control all other potential factors that might affect your study. • Observational Study: You study the environment as is, and collect data on all possible factors that might be of interest to you. • Questions 1-3 definitely observational • Question 4 could have been an experiment but possibly observational
Questions to think about: • If you had a choice: would you want to do an experiment or an observational study? • Why? • Is BIG data always better data?
What does it matter the type of study we conduct? • It matters because how we proceed to analyze the data should differ in terms of the type of study we had. • Nowadays it is common to have data collected “just because” or “opportunistic data” and these are the extreme types of observational studies. As it wasn’t collected without any aim and it is hard to figure out if it is a population or a sample.
Exploratory versus Confirmatory studies • Exploratory studies: We do not have an idea about what we expect to find. So we study a bunch of factors to see how they affect what we are studying. It can be experimental or an observational study (though generally observational) • Confirmatory Studies: Generally have an idea what we are expecting to find and do a very focused study to give credence to our beliefs. It can be experimental or an observational study (though generally experimental) • Keep in my mind we cannot use data collected in an exploratory study to confirm our belief or hypothesis.
Exploratory versus confirmatory studies • Exploratory studies generate hypothesis and often we do know/expect certain patterns • We confirm these using confirmatory studies • Though in practice people often skip the confirmatory studies…
For Big data: what are we trying to learn • This is one of the harder questions about big data • Is it a population that we have or is it a sample? • If the latter, then what is the population? • How can this sample be used to infer about a population when no frame was used to draw the sample? • And statisticians and data scientists we need to think about this.
Part 1: recap • It matters what TYPE of data we have. • It matters how the data were collected • It matters whether we have a population or a sample • It matters if you randomized the process of data collection • If the population is studied all you need to do is to summarize, with a sample we need to think of inference. • If we are really dealing with a population when we talk about big data: then all we need to do is visualize and summarize. No inference required.
Work sheet for Part 1 • What type of data are the following: • Zip code, height, phone number, yearly income, size of family • If we randomly choose 50 apple trees in an orchard and measure its height, canopy cover, number of apples: • Would this be an observational study or experiment • Would the data be univariate or multivariate • Would this be an exploratory study or a confirmatory one?
Part 2 Summarization: Making sense of numbers
Summarizing Data • Let us go back to the questions we started with: • What is your unit? • On a scale of 1 to 5 rate your liking for Stats • How many Statistics classes you have taken? • Your blood pressure when facing a Stats problem Let us think about answering these questions and address things like: univariate, bivariate and multivariate in this context.
Univariate, Bivariate and Multivariate • Univariate: ONLY one variable is measured or disseminated at a particular time • Bivariate: Two variables that of equal importance are measured or discussed together • Multivariate: Multiple variables are measured and discussed together and each of the variables are of equal importance and collected using the same general method. • Most data we collect is multivariate in nature, but we can choose to discuss one variable at a time. Not a great idea, but often done in science.
Response and Explanatory Variables For the bivariate and multivariate case we can have two different types of scenarios: • ALL variables are equally important • We are REALLY interested in one variable but collect the others to understand the variable of interest. • The one that we are really interested in is called the RESPONSE variable. The others are called Explanatory variables. It was collected to explain the response. • Response variable is taken to be a RANDOM variable (or stochastic). Explanatory variables are assumed non-random.
Multiple versus Multivariate • These are associated with whether we have multiple responses or explanatory variables: • If we have multiple response variables and we are equally interested in them: multivariate • If we have ONE response variable and multiple EXPLANATORY variables: multiple
Analyzing UNIVARIATE data • With all the terminology intact, let us consider the most simple case. • ONE response variable. • We can graph it, and summarize it if it is a population from which we have the data. • We can conduct inference if it is a sample. • How and what we do, depends upon the data type we have. • Hence, knowledge of data types is crucial
Summarizing Univariate Categorical Data • What would be some methods used to summarize categorical data? • Graphical summary and numerical summary: • What graphs are relevant for univariate categorical data? • Pie chart • Bar chart • Line chart etc…
Numerical Data: Summary • Graphical summary: • Box plots • Histograms
Snap shot (out of 100 entries) • Unit Classes_taken Scale Blood_Pressure • F 2 3 139.248 • B 2 4 136.148 • B 2 1 107.655 • C 0 1 159.391 • B 2 3 121.990 • B 4 3 140.697 • B 6 2 94.654 • A 0 1 125.146 • D 3 4 83.428
Graphs and Charts for our data Pie Chart for the units Bar Chart for classes taken
Histogram and Box-plots For Scale Summarizing BP
Summarizing Categorical data: Univariate • What numerical summaries would be relevant for categorical data: • For example let us take your MAJORs • How would you summarize all the information in our data by one (or a few numbers)? • Idea of Central Tendency: Most naturally arising data has a tendency to clump in the middle of the range of possible values.