Download

1 / 20
210 likes | 346 Views
This course focuses on energy management, covering key topics such as global energy perspectives, energy audits, conservation measures, and green building technologies. Taught by Dr. H. Ingley, students will engage in board work and practical projects to foster hands-on learning. Course assessments include homework, exams, and a project, emphasizing the importance of staying updated with daily lecture notes posted online. Understanding energy consumption, particularly in the context of North American oil consumption and sustainability, is crucial for effective management.

E N D
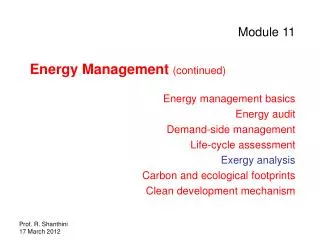
Energy Management H. A. (Skip) Ingley, PhD, PE Associate Professor in Mechanical and Aerospace Engineering Office: rm 228, MAEB building Office phone 392-9929, home 377-0078, cell 284-0997 Email: ingley@ufl.edu Web site: http://plaza.ufl.edu/ingley or mae course website Homework and notes posted on web site daily. Note: lectures purged periodically so keep up with these! There is “board work” in class, so you need to come. Don’t just rely on Powerpoint notes.
Energy Management Grading – Homework 25% Exam No. 1 25% Exam No. 2 25% Project (written 20% and oral 5%) 25%
Energy Management Week of Topic Jan 7 The Global Energy Perspective Jan 14 Energy Assessment Jan 21 Energy Audits Jan 28 Energy Audits cont’d. Project assignment Feb 4 Cost Estimating, SPB and LCC Analyses Feb 11 Operational and Maintenance Conservation Measures Feb 18 Energy Conservation Measures Feb 25 Lighting ECMs
Energy Management Mar 3 Motor ECMs Mar 5 Exam No. 1 (review during one period) Mar 17 HVAC ECMs, heat recovery ECMs, alternative energy use Mar 24 Energy Use Calculations Mar 31 Refrigeration analysis, combustion analysis, environmental impacts April 7 Green building technologies, LEEDs April 14 Projects due, presentations in class April 21 Exam No. 2
Energy Management World Energy Consumption Year 1015Btu (1.055EJ, Exa Joules) 1970 207 1975 243 1980 285 1990 348 2001 404 2010 471 2020 568 2025 623 Source: International Energy Outlook 2001 and US DOE 2001
Energy Management North American Oil Consumption Year 1015Btu (1.055EJ, Exa Joules) 1990 40.4 2001 45.9 2010 54.2 2020 64.3 2025 69.3 Source: International Energy Outlook 2003 and US DOE 2003 Note: world oil consumption for 2020 is projected at 250 Quads, North America would be about 28% of that. North America population is 6.7% of world population.
Energy Management (2000-2025) Total World Oil Resources US Resources Proved Reserves 1,212 billion barrels 22.45 Reserve Growth 730 billion barrels 76.03 Undiscovered 938 billion barrels 83.03 Includes crude oil and natural gas plant liquids Energy content: 5.8x10⁶ Btu/bbl 1,212 billion barrels is approx. equal to 7030 Quads. We ave. 244 Quads/yr consumption for this time period for a total of 6100 Quads!! That leaves enough to get to 2029 if we could keep the use at 244 Quads/yr. Source:US Geological Survey, 2000
Energy Management EJ = Exa(1018)Joules
Energy Management PRODUCTION - United States (1998)
Energy Management CONSUMPTION - United States (1998)
Energy Management Consumptionin 1997by sector: - United States
Energy Management Consumption - United States vs. World (1998)
Wedges for mitigation “For every complex problem there is an answer that is clear, simple, and wrong.” H. L. Mencken
We need at least 7 wedges William Chameides
GHG Emissions Targets Climate Action Plans Renewable Portfolios GHG Reporting Registries Efficiency Standards Regional Climate Initiatives Responses among the states The costs of climate change for Florida are possibly the highest of any state
Florida emissions among US states Florida Overall, Florida ranks 6th among the states in total CO2 emissions Center for Climate Strategies
Gains from efficiency & renewables • The Bottom Line • 45% of Florida’s electric power can be met by efficiency savings and renewables by 2023. • Florida generates 0.1% from renewables; national average = 2.3%. • Savings in electricity costs over 15 years could total $84 billion. Source: ACEEE 2007