Download
1 / 11
110 likes | 324 Views
A systems approach to pathways and networks involved in lipid metabolism in macrophage activation the LIPID MAPS Consortium University Of California San Diego. Cellular Networks. Signaling Pathways. Gene expression Protein expression Enzyme activation. Lipid Metabolites. Lipid

E N D
A systems approach to pathways and networks involved in lipid metabolism in macrophage activation the LIPID MAPS Consortium University Of California San Diego
Cellular Networks Signaling Pathways Gene expression Protein expression Enzyme activation Lipid Metabolites Lipid Associated Proteins Lipid Metabolic Pathways
LIPID MAPS TM Macrophage or endothelial cell membrane Direct Activation (Proteolysis) MAP3K Induction of inflammatory and immune response genes ACTIVATE RAW CELLS WITH Kdo2-Lipid A Measure time series of Gene, Lipid, protein and Cytokine Responses Cytokines (IL-1b, TNFa), Tissue factor, B7, etc.
MS MS MS MS MS MS MS MS MS MS MS MS MS MS MS MS MS MS MS MS MS MS MS MS MS MS MS Layers of Replications and Measurements Bio Replicates Tech Replicates Mass Spec Runs
http://www.lipidmaps.org EXPERIMENTAL DATA
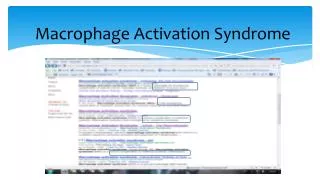
Lipidomics Data Display : Gene array-search by pathwayhttp://www.lipidmaps.org/data/results/raw2647/microarray/
Hyperlink to protein DB Hyperlink to lipid DB Lipid Pathways and Networks:Visualization toolsVANTED: Displaying lipidomic timecourse datahttp://vanted.ipk-gatersleben.de/
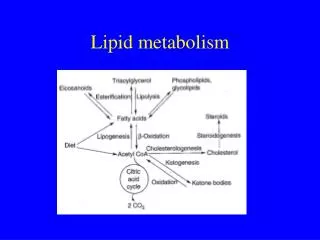
Metabolic pathway Rate limiting step LDL HDL KDO2-lipid A Sterols Glycerophospholipids Glycerolipids Fatty Acids Sphingolipids Isoprenoids Microarrayresults Signaling pathway Receptors TLR4 Proteins ABCA1 ABCG1 HMG-CoA synthase HMG-CoA reductase HMG-CoA CE Lipid rafts Serine Palmitoyltransferase Acetyl-CoA Citrate Sterol O-Acyltransferases Malony-CoA decarboxylase Acetyl CoA carboxylase Carnitine Palmitoyl Transferase (CPT-1) mitochondria Citrate Acyl-CoA LCAT Malonyl-CoA Energy metabolism cytosol DNA Acyl-CoA Fatty acid synthase Acyltransferases ACS lipases PPAR PLA PLC FAT/CD36 FATP Fatty Acid Physical interaction Integrated lipids, genes, and pathways data across timecourse experiments for RAW 264.7 cells treated with Kdo2-lipid A LIPID MAPS funded by Glue Grant from: www.nigms.nih.gov www.lipidmaps.org Overview Fatty Acids: Omega-3 and Omega-6 polyunsaturated fatty acids Glycerophospholipids Sterols Fatty Acids: Eicosanoids Sphingolipids Fatty Acids: Omega-9 polyunsaturated and straight chain fatty acids
http://www.signalinggateway.org EXPERIMENTAL DATA
10’ Ca++ 0.5’ 1’ cAMP 3’ 8’ 20’ 2.5’ Phospho Protein 5’ 15’ 30’ 30’ Micro Array 1 hr 2 hr 4 hr Ligand Screen – Time Course