Download
1 / 71
730 likes | 924 Views
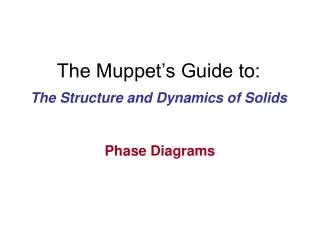
The Muppet’s Guide to:. The Structure and Dynamics of Solids. Phase Diagrams. T (°C). • 2 phases:. 1600. L. (liquid). 1500. L (liquid). a. (FCC solid solution). • 3 phase fields: . 1400. L. a. liquidus. + . 1300. a. L +. L. solidus. a. a. 1200. (FCC solid . 1100.

E N D
The Muppet’s Guide to: The Structure and Dynamics of Solids Phase Diagrams
T(°C) • 2 phases: 1600 L (liquid) 1500 L (liquid) a (FCC solid solution) • 3 phase fields: 1400 L a liquidus + 1300 a L + L solidus a a 1200 (FCC solid 1100 solution) 1000 wt% Ni 0 20 40 60 80 100 Phase Diagrams • Indicate phases as function of T, Co, and P. • For this course: -binary systems: just 2 components. -independent variables: T and Co (P = 1 atm is almost always used). • Phase Diagram for Cu-Ni at P=1 atm. Figure adapted from Callister, Materials science and engineering, 7th Ed.
T(°C) 1600 1500 L (liquid) 1400 a liquidus + 1300 L solidus a 1200 (FCC solid 1100 solution) 1000 wt% Ni 0 20 40 60 80 100 Phase Diagrams • Indicate phases as function of T, Co, and P. • For this course: -binary systems: just 2 components. -independent variables: T and Co (P = 1 atm is almost always used). Liquidus: Separates the liquid from the mixed L+aphase • Phase Diagram for Cu-Ni at P=1 atm. Solidus: Separates the mixed L+aphase from the solid solution Figure adapted from Callister, Materials science and engineering, 7th Ed.
T(°C) 1600 L (liquid) 1500 a 1 phase: Cu-Ni phase diagram liquidus B (1250°C, 35): (1250°C,35) 1400 solidus a 2 phases: L + a a + 1300 L B (FCC solid 1200 solution) 1100 A(1100°C,60) 1000 wt% Ni 0 20 40 60 80 100 Number and types of phases • Rule 1: If we know T and Co, then we know: - the number and types of phases present. • Examples: A(1100°C, 60): Figure adapted from Callister, Materials science and engineering, 7th Ed.
Cu-Ni system T(°C) A T C = 35 wt% Ni A o tie line liquidus L (liquid) At T = 1320°C: 1300 A a + L Only Liquid (L) B T solidus B C = C ( = 35 wt% Ni) L o a a At T = 1190°C: + D L (solid) 1200 D a Only Solid ( ) T D C = C ( = 35 wt% Ni ) a o 32 35 4 3 20 30 40 50 At T = 1250°C: C C C a B L o wt% Ni a Both and L C = C ( = 32 wt% Ni here) L liquidus C = C ( = 43 wt% Ni here) a solidus Composition of phases • Rule 2: If we know T and Co, then we know: --the composition of each phase. • Examples: Figure adapted from Callister, Materials science and engineering, 7th Ed.
Cooling a Cu-Ni Binary - Composition T(°C) L: 35wt%Ni L (liquid) Cu-Ni system a 130 0 A + L L: 35 wt% Ni B a: 46 wt% Ni 35 46 C 32 43 D L: 32 wt% Ni 24 36 a a : 43 wt% Ni + 120 0 E L L: 24 wt% Ni a : 36 wt% Ni a (solid) 110 0 35 20 3 0 4 0 5 0 wt% Ni C o • Phase diagram: Cu-Ni system. • System is: --binary i.e., 2 components: Cu and Ni. --isomorphous i.e., complete solubility of one component in another; a phase field extends from 0 to 100 wt% Ni. • Consider Co = 35 wt%Ni. USE LEVER RULE Figure adapted from Callister, Materials science and engineering, 7th Ed.
T(°C) tie line liquidus L (liquid) 1300 a + M ML L B solidus T B a a + L (solid) 1200 R S S R 20 3 0 4 0 5 0 C C C a L o wt% Ni The Lever Rule – Weight % • Tie line – connects the phases in equilibrium with each other - essentially an isotherm • How much of each phase? Think of it as a lever Figure adapted from Callister, Materials science and engineering, 7th Ed.
Weight fractions of phases – ‘lever rule’ Cu-Ni system T(°C) A T C = 35 wt% Ni A o tie line liquidus L (liquid) At T : Only Liquid (L) 1300 a A + L B W = 100 wt%, W = 0 a L T solidus B S R a At T : Only Solid ( ) D a a + W = 0, W = 100 wt% L a L (solid) 1200 D T a D At T : Both and L B 32 35 4 3 20 3 0 4 0 5 0 S = WL C C C a L o wt% Ni R + S R = = 27 wt% Wa R + S • Rule 3: If we know T and Co, then we know: --the amount of each phase (given in wt%). • Examples: Figure adapted from Callister, Materials science and engineering, 7th Ed.
Cooling a Cu-Ni Binary – wt. % T(°C) L: 35wt%Ni L (liquid) Cu-Ni system a 130 0 A + L L: 92 wt% B a: 8 wt% 34 46 C 32 43 D L: 73 wt% 24 36 a a : 27 wt% + 120 0 E L L: 8 wt% a : 92 wt% a (solid) 110 0 35 20 3 0 4 0 5 0 wt% Ni C o • Phase diagram: Cu-Ni system. • System is: --binary i.e., 2 components: Cu and Ni. --isomorphous i.e., complete solubility of one component in another; a phase field extends from 0 to 100 wt% Ni. • Consider Co = 35 wt%Ni. Figure adapted from Callister, Materials science and engineering, 7th Ed.
Equilibrium cooling • Multiple freezing sites • Polycrystalline materials • Not the same as a single crystal • The compositions that freeze are a function of the temperature • At equilibrium, the ‘first to freeze’ composition must adjust on further cooling by solid state diffusion
Diffusion is not a flow Concept behind mean free path in scattering phenomena - conductivity Our models of diffusion are based on a random walk approach and not a net flow http://mathworld.wolfram.com/images/eps-gif/RandomWalk2D_1200.gif
Diffusion in 1 Dimension • Fick’s First Law J = flux – amount of material per unit area per unit time C = concentration Diffusion coefficient which we expect is a function of the temperature, T
Diffusion cont…. • Requires the solution of the continuity equation: The change in concentration as a function of time in a volume is balanced by how much material flows in per time unit minus how much flows out – the change in flux, J: • giving Fick’s second law (with D being constant): BUT
C x Solution of Ficks’ Laws For a semi-infinite sample the solution to Ficks’ Law gives an error function distribution whose width increases with time t = 0 C Co t = t
Consider slabs of Cu and Ni. Interface region will be a mixed alloy (solid solution) Interface region will grow as a function of time
Slow Cooling in a Cu-Ni Binary T(°C) L: 35wt%Ni L (liquid) Cu-Ni system a 130 0 A + L L: 35 wt% Ni B a: 46 wt% Ni C D L: 32 wt% Ni a a : 43 wt% Ni + 120 0 E L L: 24 wt% Ni a : 36 wt% Ni a (solid) 110 0 35 20 3 0 4 0 5 0 wt% Ni C o Co = 35 wt%Ni. Enough time is allowed at each temperature change for atomic diffusion to occur. – Thermodynamic ground state Each phase is homogeneous Figure adapted from Callister, Materials science and engineering, 7th Ed.
L α + L α Non – equilibrium cooling No-longer in the thermodynamic ground state Reduces the melting temperature Figure adapted from Callister, Materials science and engineering, 7th Ed.
Cored vs Equilibrium Phases Uniform C : a a First to solidify: 35 wt% Ni 46 wt% Ni a Last to solidify: < 35 wt% Ni • Ca changes as we solidify. • Cu-Ni case: First a to solidify has Ca = 46 wt% Ni. Last a to solidify has Ca = 35 wt% Ni. • Fast rate of cooling: Cored structure • Slow rate of cooling: Equilibrium structure Figure adapted from Callister, Materials science and engineering, 7th Ed.
Binary-Eutectic Systems – Cu/Ag has a special composition with a min. melting temperature 2 components a phase: Mostly copper b phase: Mostly Silver Solvus line – the solubility limit • Limited solubility – mixed phases • 3 phases regions, L, a and b and 6 phase fields - L, a and b, L+a, L+b, a+b Figure adapted from Callister, Materials science and engineering, 7th Ed.
Binary-Eutectic Systems Cu-Ag system T(°C) 1200 L (liquid) 1000 a L + a b 779°C L + b 800 TE CaE=8.0 CE=71.9 CbE=91.2 600 a + b 400 200 80 100 0 20 40 60 CE Co wt% Ag in Cu/Ag alloy • Eutectic transition L(CE) (CE) + (CE) The Eutectic point TE, Eutectic temperature, 779°C CE, eutectic composition, 71.9wt.% E : No liquid below TE • TE Min. melting TE Any other composition, Liquid transforms to a mixed L+solid phase Figure adapted from Callister, Materials science and engineering, 7th Ed.
Pb-Sn (Solder) Eutectic System (1) T(°C) 300 L (liquid) a L + a b b L + 200 183°C 18.3 61.9 97.8 C- CO 150 S R S = W = a R+S C- C 100 a + b 99 - 40 59 = = = 67 wt% 99 - 11 88 100 0 11 20 60 80 99 40 CO - C R W = = C Co C, wt% Sn C C - C R+S 40 - 11 29 = = 33 wt% = 99 - 11 88 • For a 40 wt% Sn-60 wt% Pb alloy at 150°C, find... --the phases present: a + b Pb-Sn system --compositions of phases: CO = 40 wt% Sn Ca = 11 wt% Sn Cb = 99 wt% Sn --the relative amount of each phase: Figure adapted from Callister, Materials science and engineering, 7th Ed.
Microstructures in Eutectic Systems: II L: Co wt% Sn T(°C) 400 L L 300 a L + a a: Cowt% Sn a 200 TE a b 100 b + a Pb-Sn system 0 10 20 30 Co , wt% Sn Co 2 (sol. limit at T ) 18.3 room (sol. limit at TE) • • 2 wt% Sn < Co < 18.3 wt% Sn • • Result: • Initially liquid → liquid + • then alone • finally two phases • a poly-crystal • fine -phase inclusions Figure adapted from Callister, Materials science and engineering, 7th Ed.
Microstructures in Eutectic Systems: Co=CE Micrograph of Pb-Sn T(°C) eutectic L: Co wt% Sn microstructure 300 L Pb-Sn system a L + a b L 200 183°C TE 100 160m a : 97.8 wt% Sn : 18.3 wt%Sn 0 20 40 60 80 100 97.8 18.3 CE C, wt% Sn 61.9 • Result: Eutectic microstructure (lamellar structure) --alternating layers (lamellae) of a and b crystals. Figures adapted from Callister, Materials science and engineering, 7th Ed.
Microstructures in Eutectic Systems: Co=CE T(°C) L: Co wt% Sn 300 L Pb-Sn system a L + a b L 200 183°C TE 100 a : 97.8 wt% Sn : 18.3 wt%Sn 0 20 40 60 80 100 97.8 18.3 CE C, wt% Sn 61.9 • Result: Eutectic microstructure (lamellar structure) --alternating layers (lamellae) of a and b crystals. Pb rich Sn Rich Figures adapted from Callister, Materials science and engineering, 7th Ed.
Lamellar Eutectic Structure At interface, Pb moves to a-phase and Sn migrates to b- phase Lamellar form to minimise diffusion distance – expect spatial extent to depend on D and cooling rates. Sn Pb Figure adapted from Callister, Materials science and engineering, 7th Ed.
Microstructures IV • Just above TE : L a C = 18.3 wt% Sn a L a CL = 61.9 wt% Sn S W a = 50 wt% = R + S WL = (1- W ) = 50 wt% a R S a b + 18.3 61.9 • 18.3 wt% Sn < Co < 61.9 wt% Sn • Result:a crystals and a eutectic microstructure T(°C) L: Co wt% Sn 300 L Pb-Sn system a L + a b b L + 200 TE 100 0 20 40 60 80 100 Co, wt% Sn Figure adapted from Callister, Materials science and engineering, 7th Ed.
Microstructures IV L a L a R S S R • Just below TE : C = 18.3 wt% Sn a a b + C = 97.8 wt% Sn b S W a = 73 wt% = R + S W = 27 wt% b 18.3 61.9 97.8 • 18.3 wt% Sn < Co < 61.9 wt% Sn • Result:a crystals and a eutectic microstructure T(°C) L: Co wt% Sn 300 L Pb-Sn system a L + a b b L + 200 TE 100 Primary, a 0 20 40 60 80 100 Eutectic, a Eutectic, b Co, wt% Sn Figure adapted from Callister, Materials science and engineering, 7th Ed.
Intermetallic Compounds a phase: Mostly Mg Mg2Pb b phase: Mostly Lead Note: intermetallic compound forms a line - not an area - because stoichiometry (i.e. composition) is exact. Figure adapted from Callister, Materials science and engineering, 7th Ed.
Peritectic transition + L Eutectoid transition + Eutectoid & Peritectic mixed liquid and solid to single solid transition Cu-Zn Phase diagram Solid to solid ‘eutectic’ type transition Figure adapted from Callister, Materials science and engineering, 7th Ed.
-Eutectic (A): g + L Fe3C A -Eutectoid (B): R S g a + Fe3C g g g g B 727°C = T eutectoid R S a +Fe3C 4.30 0.76 120 mm Fe3C (cementite-hard) Result: Pearlite = alternating layers of eutectoid a (ferrite-soft) a and Fe3C phases C Iron-Carbon (Fe-C) Phase Diagram T(°C) • 2 important 1600 points d L 1400 g +L g 1200 L+Fe3C 1148°C (austenite) 1000 g +Fe3C a Fe3C (cementite) + 800 g a 600 400 0 1 2 3 4 5 6 6.7 Co, wt% C (Fe) Figure adapted from Callister, Materials science and engineering, 7th Ed.
Iron-Carbon http://www.azom.com/work/pAkmxBcSVBfns037Q0LN_files/image003.gif
The Muppet’s Guide to: The Structure and Dynamics of Solids The Final Countdown
Characterisation Over the course so far we have seen how thermodynamics plays an important role in defining the basic minimum energy structure of a solid. Small changes in the structure (such as the perovskites) can produce changes in the physical properties of materials Kinetics and diffusion also play a role and give rise to different meta-stable structures of the same materials – allotropes / polymorphs Alloys and mixtures undergo multiple phase changes as a function of temperature and composition BUT how do we characterise samples?
Probes Resolution better than the inter-atomic spacings • Electromagnetic Radiation • Neutrons • Electrons
Probes Treat all probes as if they were waves: Wave-number, k: Momentum, p: Photons ‘Massive’ objects
Xavier the X-ray Speed of Light Wavelength Planck’s constant Ex(keV)=1.2398/l(nm) Elastic scattering as Ex>>kBT
Norbert the Neutron De Broglie equation: mass velocity Kinetic Energy: En(meV)=0.8178/l2(nm) Strong inelastic scattering as En~kBT
Eric the Electron • Eric’s rest mass: 9.11 × 10⁻³¹ kg. • electric charge: −1.602 × 10⁻¹⁹ C • No substructure – point particle De Broglie equation: mass velocity Eedepends on accelerating voltage :– Range of Energies from 0 to MeV
Probes Resolution better than the interatomic spacings Absorption low – we want a ‘bulk’ probe • Electrons - Eric • quite surface sensitive • Electromagnetic Radiation - Xavier • Optical – spectroscopy • X-rays : • VUV and soft (spectroscopic and surfaces) • Hard (bulk like) • Neutrons - Norbert
Interactions Englebert Xavier Norbert 1. Absorption 2. Refraction/Reflection 3. Scattering Diffraction
a Crystals are 2D with planes separated by dhkl. There will only be constructive interference when == - i.e. the reflection condition.
Basic Scattering Theory Differential cross-section Unit solid angle The number of scattered particles per second is defined using the standard expression Defined using Fermi’s Golden Rule
Spherical Scattered Wavefield Incident Wavefield Scattering Potential Different for X-rays, Neutrons and Electrons
BORN approximation: • Assumes initial wave is also spherical • Scattering potential gives weak interactions Scattered intensity is proportional to the Fourier Transform of the scattering potential
Scattering from Crystal As a crystal is a periodic repetition of atoms in 3D we can formulate the scattering amplitude from a crystal by expanding the scattering from a single atom in a Fourier series over the entire crystal Atomic Structure Factor Real Lattice Vector: T=ha+kb+lc
The Structure Factor Describes the Intensity of the diffracted beams in reciprocal space hkl are the diffraction planes, uvw are fractional co-ordinates within the unit cell If the basis is the same, and has a scattering factor, (f=1), the structure factors for the hkl reflections can be found
The Form Factor Describes the distribution of the diffracted beams in reciprocal space The summation is over the entire crystal which is a parallelepiped of sides:
The Form Factor Measures the translational symmetry of the lattice Deviation from reciprocal lattice point located at d* Redefine q: The Form Factor has low intensity unless q is a reciprocal lattice vector associated with a reciprocal lattice point N=500 N=2,500; FWHM-1.3”
The Form Factor N=10 N=500 The square of the Form Factor in one dimension
Scattering in Reciprocal Space Peak positions and intensity tell us about the structure: PERIODICITY WITHIN SAMPLE POSITION OF PEAK EXTENT OF PERIODICITY WIDTH OF PEAK POSITION OF ATOMS IN BASIS INTENSITY OF PEAK